Skip to first unread message

Francesco Tamiro
Nov 18, 2022, 2:07:37 PM11/18/22
to cBioPortal for Cancer Genomics Discussion Group
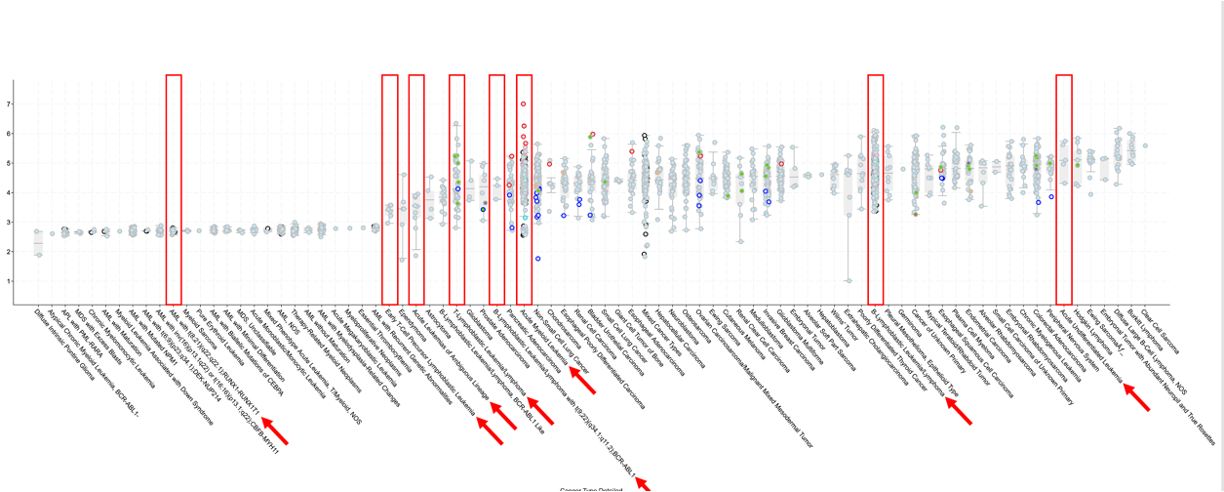
I am probably making a naive and stupid question, but some months ago we received data from a collaborator that used cBioportal, showing a comparison of RNA and protein levels for a certain gene and the plots had different studies aggregated (mostly leukemia, but also some solid tumors, and then only leukemia-focused studies).
I need to replicate that kind of analysis. I explored the site, and I did my homework by reading around and watching the tutorials available, but I am not able to replicate that kind of plot and analysis. Am I missing something, or maybe there was an update and now we cannot compare across different studies?
Attaching a plot for reference. Please ignore red boxes and arrows as those were added later.
Thanks,
Francesco

Aaron L
Nov 18, 2022, 3:22:08 PM11/18/22
to Francesco Tamiro, cBioPortal for Cancer Genomics Discussion Group
Hi Francesco,
Not stupid! We apologize for the announced disappearance of this capability. We decided to shut it off because expression data is not normalized across studies (except among the TCGA PanCan Atlas studies). In the future there is a plan to further identify classes of studies that can be compared (a la PanCan) in this way.
Let us know if you have further questions.
--Aaron
--
You received this message because you are subscribed to the Google Groups "cBioPortal for Cancer Genomics Discussion Group" group.
To unsubscribe from this group and stop receiving emails from it, send an email to cbioportal+...@googlegroups.com.
To view this discussion on the web visit https://groups.google.com/d/msgid/cbioportal/0421f31c-a166-40ea-bc7f-a5183179d3b0n%40googlegroups.com.
Francesco Tamiro
Nov 18, 2022, 7:24:41 PM11/18/22
to cBioPortal for Cancer Genomics Discussion Group
Hi Aaron,
Thank you so much for the quick and informative answer. I strongly suspected this could be the reason, and I am well aware of the problem of comparing such data from different studies. But thanks for confirming this!
Best,
Francesco

Nikolaus Schultz
Nov 18, 2022, 11:47:40 PM11/18/22
to Francesco Tamiro, cBioPortal for Cancer Genomics Discussion Group
Hi Francesco,
We still have this functionality for the TCGA Pan Cancer Atlas studies.
Try the link below, or get to this using the following steps:
1 -Quick Select TCGA PanCancer Atlas Studies
2 - Enter a gene of your choice and hit Query by Gene
3 - Select the Plots tab
4 - Under Examples, click on mRNA vs Study (all the way on the right).
Niki.
To view this discussion on the web visit https://groups.google.com/d/msgid/cbioportal/38a27ae8-e541-433b-aca8-d87c583ed008n%40googlegroups.com.
Reply all
Reply to author
Forward
0 new messages