How to plot latency variang "Scheduled Access length" and RAP1 length
37 views
Skip to first unread message

marwen amiri
Mar 23, 2021, 2:44:52 PM3/23/21
to Castalia Simulator
Hello everyone, Hello Dr. Boulis
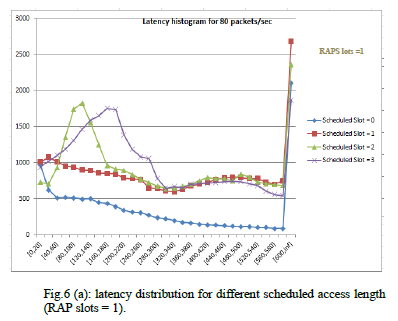
Can anybody tell me how to plot latency varying for example Scheduled Access length or RAP1 length ?
which commands I have to write and is what when launching the simulation or when displaying the latency: CastaliaResults file.txt -s latency
I put you the display that I want to have it for the latency in a figure (it's an example take from an a paper) : which commands I must write to have the same latency graph ? how to varying RAP and Scheduled slots in latecy graph
Reply all
Reply to author
Forward
0 new messages