Negative values in vertical_bar_plot

Eduardo T. Cardoso
I recently ran into an issue with negative values in
vertical_bar_plot(). I tried it on v1.1, and then on trunk, but none
of them supported it, generating really ugly graphics.
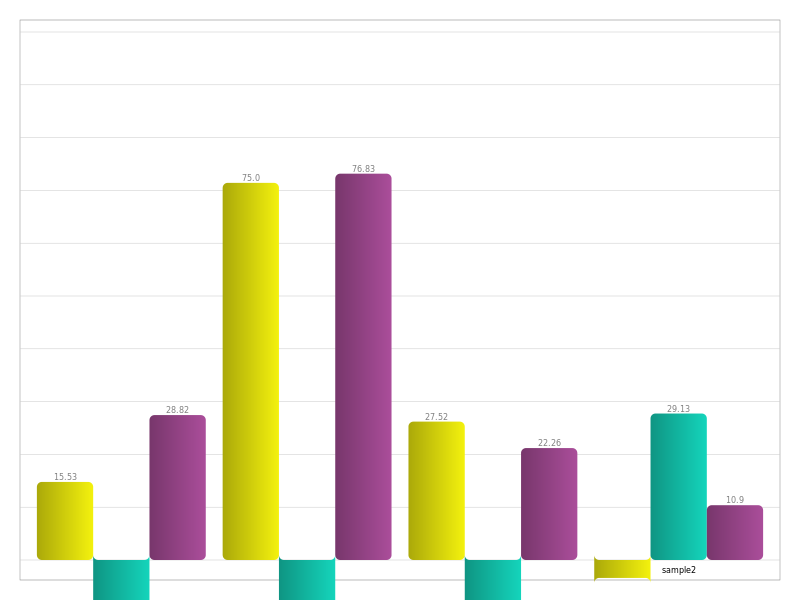
I've attached a 'sample.py' file that generates a sample bar plot with
negative values and two images: 'sample_current.png' and
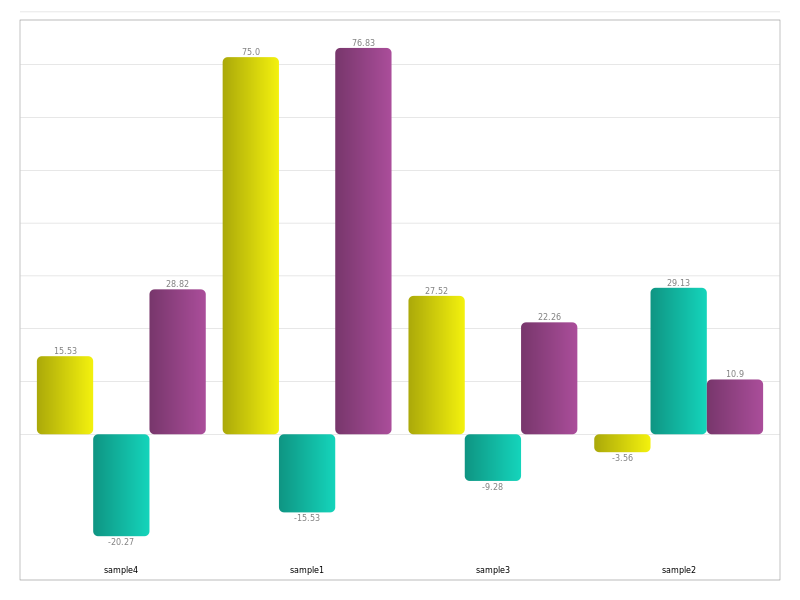
'sample_proposed.png'. The first one is the current implementation of
CairoPlot, and the second is something along the lines of what I'd
like to see.
To achieve that, I did some hackings in the code. The image I attached
have been generated after my modifications, but as you can see, there
are still some small glitches: first, I managed to move the grid so it
lines up with the value 0, but still haven't fiddled with it enough to
draw grid lines for negative values; and second, the labels for
negative values are still slightly misaligned (it seems slightly
dependant on the scale used when plotting, showing up off by one or
two pixels every now and then).
I'm not very familiar with the code, so I may have done things the
wrong way (well, some things I clearly hacked in hehe). I have
attached a diff ('cairoplot.py.diff') with the changes I have made and
would like to discuss them, gather suggestions and help on wheter to
add support for negative values in CairoPlot's vertical_bar_plot and
how to do it cleanly.
Also, I recommend commenting out the line that sets the y_bounds on
'sample.py' and seeing the result. It's not very pretty as it lacks
margin. That's another area that needs improvement.
Please let me know what you think.
Thanks in advance,
Eduardo.
Eduardo T. Cardoso
eventually contribute with the code. Maybe I should file a bug report
in Launchpad to "get the ball rolling"?
Thanks again,
Eduardo

Rodrigo Araújo
Eduardo T. Cardoso
Thanks for the reply.
My hacks (which I have attached the diff to the first email, not sure
if you had time to check it) were sufficient to produce the graphs I
needed for my slides with some quick help from GIMP for the missing
grid lines, so I am good for now.
I really don't mind waiting, it's just that I'd be willing to help. I
fixed the necessary parts for vertical_bar_plot (with the exception of
the grid lines), but I'm wondering if there are other places to fix
for other graphs (or if I broke the horizontal_bar_plot with the
changes, for instance). Since I am not that familiar with the
library's inner workings, I might have done things the wrong way :-)
I was keeping myself from doing subsequent changes until I had some
feedback, but I guess I'll try playing with it some more then. Maybe I
can make it a bit cleaner and complete. This way, we might speed up
the process and maybe even get it in time for 1.2! I might need your
help to clarify some parts of the code though. Would you be willing to
answer a couple more emails? :-)
Friendly,
Eduardo