Having trouble to interpret the learning curve and tune the learning rate
374 views
Skip to first unread message

yang chu
Nov 10, 2015, 11:25:34 PM11/10/15
to Caffe Users
Hi :)
I am trying to train a CNN for a regression task using Euclidean Loss function and SGD solver.
I tried some different learning rates and plotted the learning curves.
The learning rates are 1e-8, 3e-9, and 6e-10 respectively. All of the three learning curve show a sudden drop during the training(see pictures below). And the final test losses are about 100, 160 and 200 correspondingly.
I wonder that whether the sudden drop indicates that my learning rates are all too high? But why the final loss increases when I decrease the learning rate?
Or I am heading for the wrong direction. Since it is normal to have this kind of learning curve and I should spend my time on other issues, such as using AdaDelta instead of SGD, or revising my network structure?
Could you help me out? And thank you in advance.
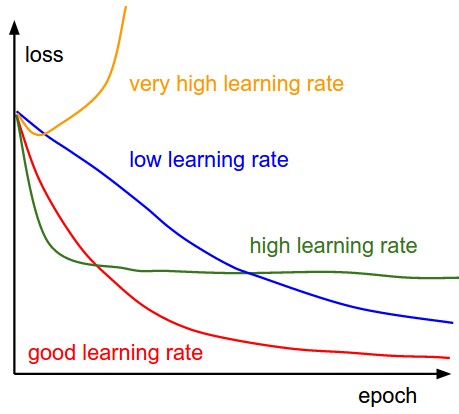
I learned from http://cs231n.github.io/neural-networks-3/ that the leaning curve should looks like the red one below.
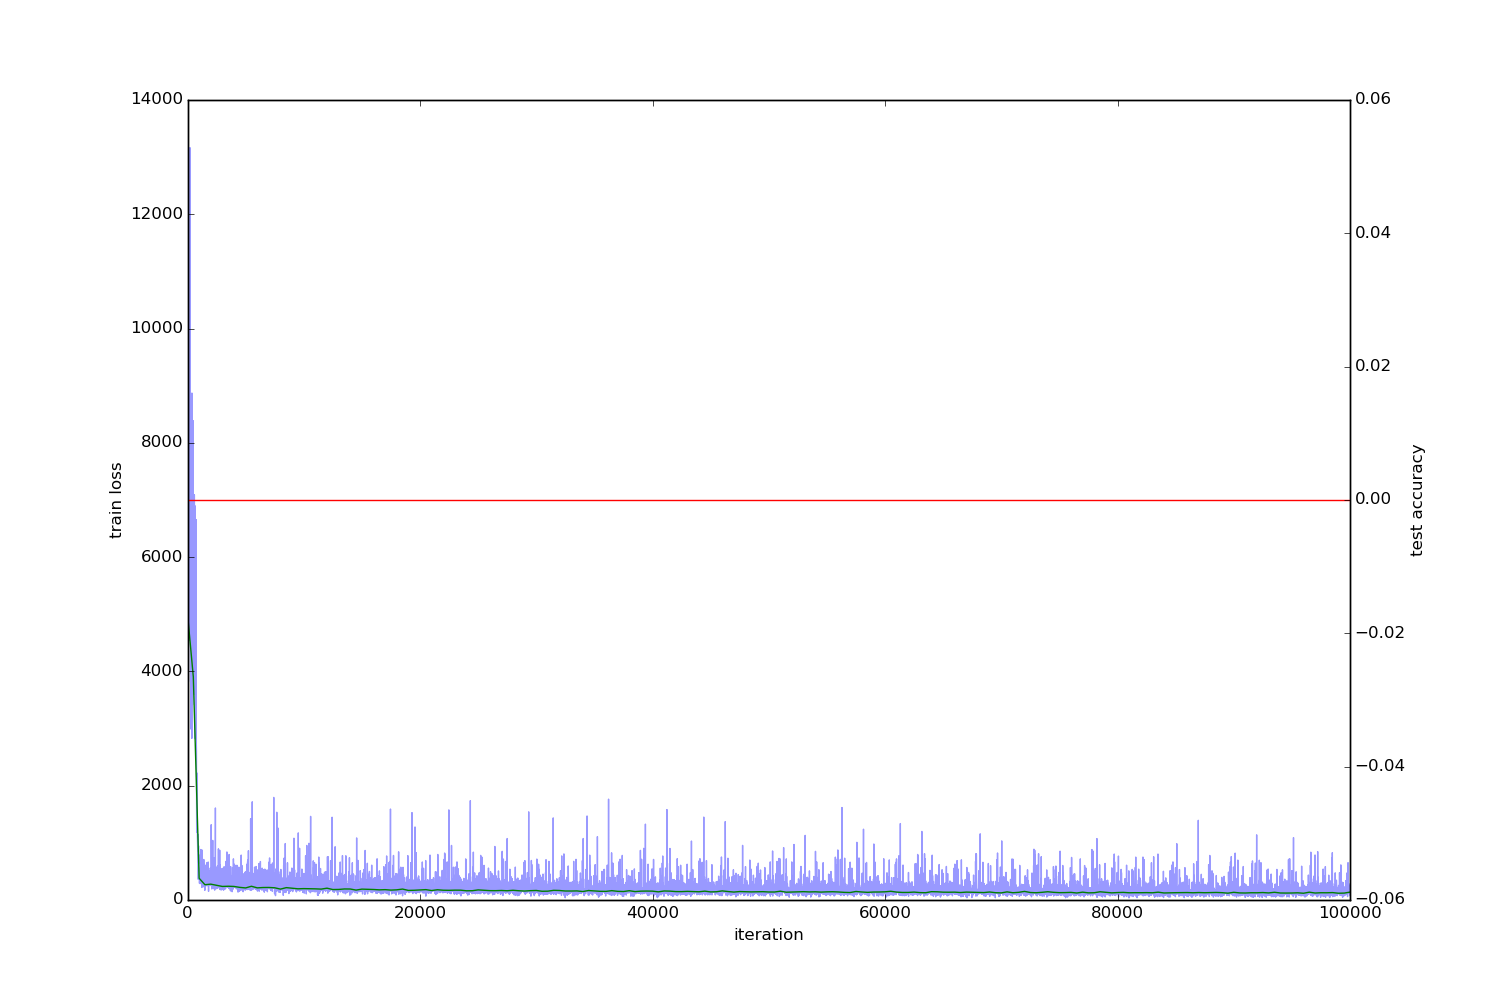
but my learning curves look like this for lr = 1e-8, where the x axis is batch number, the y axis is Euclidean loss, the blue line is training loss, the green line is validation/test loss, and please ignore the red classification accuracy line for the regression task. There is a sudden drop at about 1000 training step. You may need zoom the picture for clarity.
And lr = 3e-9

And lr = 6e-10


Killer Whale
Apr 13, 2016, 11:56:18 PM4/13/16
to Caffe Users
I know this has been sometime. But Yang, in case you are still interested in this topic, have you tried to decay your learning rate as time go by?
Reply all
Reply to author
Forward
0 new messages