Skip to first unread message

Tran Hoan
May 13, 2015, 4:29:17 AM5/13/15
to caffe...@googlegroups.com
Dear all,
I'm dealing with classify problem of 16bit CT images. I have questions about how to modify caffe for using 16 bit data.
The CT values are in range [-1024, 1023], so to prepare input for caffe, I convert these values to uint16 png files as follow:
(1) new_value = 65535 * (old_value - min)/(max-min).astype(uint16)
[-1024, 1023] -> uint16 with range [0, 65535]
Then I have uint16 bit png files for input (I need 16 bits because CT values are useful for my task).
My question is HOW TO USE CAFFE FOR 16 BIT PNG IMAGES?
I tried to use caffe and CIFAR Network in tutorial for classifying these images and found that caffe has default for uint8 data (see at io.cpp, data_transformer.cpp, data_layer.cpp, convert_image.cpp)
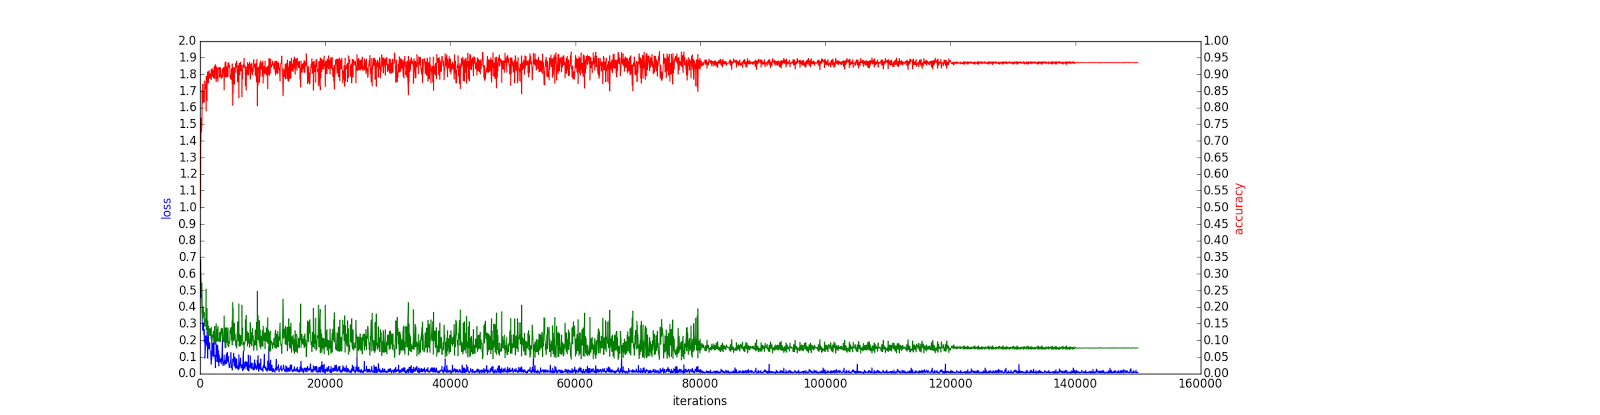
After modifying these source codes for reading my input, I checked that the input didn't lose bits after creating leveldb and passing through data layer. Okie, it's good, then the training accuracy graph is below:
Learning rate update:
80000 iterations: 0.001
Next 40000 iterations: 1e-4
Next 20000 iterations: 1e-5
Next 10000 iterations: 1e-6
TRAINING GRAPH FOR 16 BIT PNG IMAGES with modified caffe

It's kind of weird graph with some fluctuations and peaks, cause when I decreased the file to 8 bits and used original caffe, I got the better results with totally different graph.
(2) new_value = 255* (old_value - min)/(max-min).astype(uint8)
[-1024, 1023] -> uint8 with range [0, 255]
TRAINING GRAPH FOR 8 BIT PNG IMAGES
By the way, I did one more experiment that try to convert CT value to [0, 255] but save it in 16 png image
(3) new_value = 255* (old_value - min)/(max-min).astype(uint16)
[-1024, 1023] -> uint16 with range [0, 255]
The training graph will be the next one (Notice that I used my modified caffe for 16bit input data)

The last graph has the same trend with the first ones, make me thinking that my modified source code is right. But I don't know why the second graph has the bad trend. Is there something else (for example: bias term, my MAX-MIN normalization ) for the range of input data or somewhere in caffe code that tricks these 16 bit data?
Tran Hoan
May 13, 2015, 4:33:31 AM5/13/15
to caffe...@googlegroups.com
I'm sorry, I mean:
2015年5月13日水曜日 17時29分17秒 UTC+9 Tran Hoan:
The last graph has the same trend with the second, make me thinking that my modified source code is right. But I don't know why the first graph has the bad trend.
2015年5月13日水曜日 17時29分17秒 UTC+9 Tran Hoan:

jhon.smi...@gmail.com
Dec 2, 2015, 1:41:45 AM12/2/15
to Caffe Users
Hi All,
I have the same issue of using 16 bits tif images.
Could you mind share your modification in the code such I can place them as well.
Thanks,
Jhon
Reply all
Reply to author
Forward
0 new messages