
Caffe User
Mar 14, 2015, 8:33:15 PM3/14/15
to caffe...@googlegroups.com
Hello.
I have been trying to do class model visualization described in Karen Simonyan's paper (http://arxiv.org/pdf/1312.6034.pdf).
By using the pre-trained ImageNet model in Caffe, I want to find an input image (like Figure 1 in the above paper) that maximizes the score of each class.
Through following this post (https://github.com/BVLC/caffe/issues/833), I was able to compute the derivative of the loss function w.r.t to an input image.
However, I am having hard time in constructing optimizer. My code below prints some result, but it is not as good as Figure 1 in the paper. Yangqing mentioned to use standard optimizer like sklearn's optimization toolbox, but I could not understand well. Could you give me some advice for constructing optimizer to have results like Figure 1? I appreciate your help!
P.S. Because the paper mentioned it is not good to use softmax layer, so I am using sigmoid loss, instead.
def classDeconvnet():    lossModelFile = '/home/dkkim930122/caffe-master/examples/deconvnet/imagenet_deploy.prototxt'# has SIGMOID_CROSS_ENTROPY_LOSS    trainedModel = '/home/dkkim930122/caffe-master/examples/deconvnet/caffe_reference_imagenet_model'    meanFile = '/home/dkkim930122/caffe-master/examples/deconvnet/imagenet_mean.npy'
    # Create net (loss)    caffe.set_mode_gpu()    net = caffe.Classifier(lossModelFile, trainedModel)    #net.set_mean('data', np.load(meanFile))    net.set_raw_scale('data', 255)    net.set_channel_swap('data', (2,1,0))
    # Display Net structure    print 'Net structure:'    for blobName, v in net.blobs.items():        print (blobName, v.data.shape)
    lastBlobName = blobName
    maxIteration = 100    learning_rate = 0.01    label_index = 281
    caffeInput = np.random.random((1,3,227,227))
    caffeLabel = np.zeros((1,1000,1,1))# for SIGMOID_CROSS_ENTROPY_LOSS (https://groups.google.com/forum/#!searchin/caffe-users/SIGMOID_CROSS_ENTROPY_LOSS/caffe-users/19XfmJqg34Q/Id_jnm_L0iIJ)    caffeLabel[0][label_index] = 1;        for iteration in range(maxIteration):        print 'iteration at:', iteration                # forward        forwardOutput = net.forward(data=caffeInput, label=caffeLabel)
        # backward        backwardOutput = net.backward(**{net.outputs[0]: forwardOutput[lastBlobName]})        diff = backwardOutput['data']
        caffeInput = caffeInput - learning_rate * caffeInput * diff# multiplication is element wise multiplication
    plt.figure()    plt.imshow(caffeInput[0].transpose(1,2,0))
    plt.show()

Nanne van Noord
Mar 16, 2015, 5:24:13 AM3/16/15
to caffe...@googlegroups.com
'P.S. Because the paper mentioned it is not good to use softmax layer, so I am using sigmoid loss, instead. '
However, since they give a 'function' they're trying to optimise in the paper you probably want to base your loss on that. ;-)
I believe their aim with their remark not to use Softmax was to recommend not using any normalisation at all, so also not a sigmoid loss.
Anyway, I played around with this for a bit. What seemed to help for me was to use an initial input with a smaller standard deviation (i.e. caffeInput = np.random.random((1,3,227,227) * 0.1) , and to not have a loss layer and calculate the loss myself. The most basic way to do that would be to simply do:
target = 4 # the class you want to visualise
diff = np.zeros((1,1000,1,1))
diff[0,target,0,0] = 1 # loss
back = net.backward(**{net.outputs[0]:diff})
However, since they give a 'function' they're trying to optimise in the paper you probably want to base your loss on that. ;-)
Note that in http://arxiv.org/abs/1412.1897 they also implemented this visualisation method and were unable to produce high confidence images that looked at nice as the one in Simonyan et al. so it might be that they did some form of early stopping.
Caffe User
Mar 18, 2015, 3:51:59 PM3/18/15
to caffe...@googlegroups.com
Dear Nanne van Noord,
Hello. I sincerely appreciate your helpful advice!
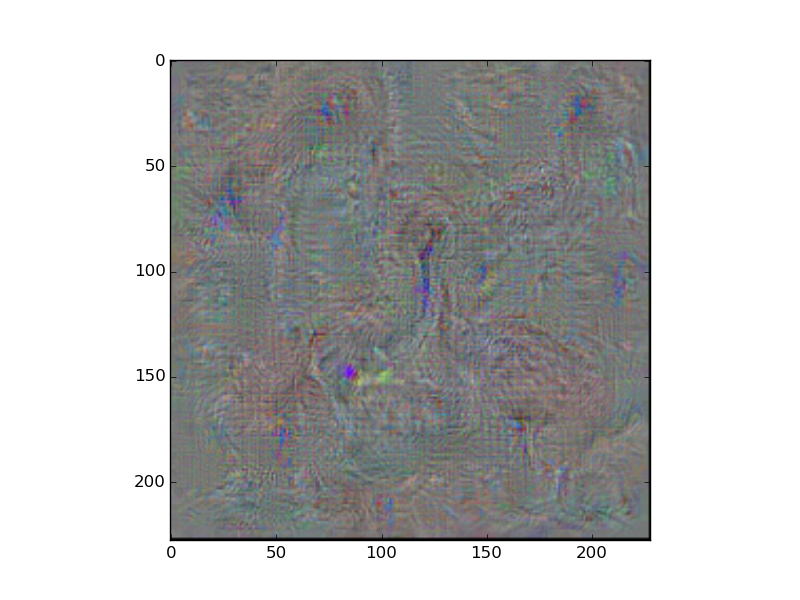
With your advice, I was able to write down the code below and produce a "Goose" figure (Please see attached image (notAddedMeanImage.png))!
Please notice that "imagenetfc8ModelFile" contains layers upto fc8.
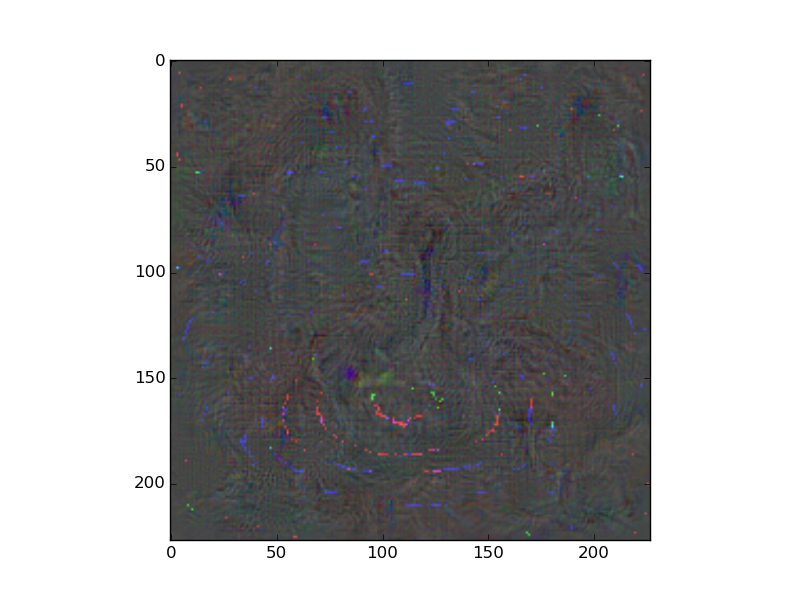
However, I had one issue of adding the training set mean image to the result.
Because the result image was 227x227 and the mean image was 256x256, I used resize function from PIL Image to change the mean image to 227x227.
I normalized them, added them together, and visualized the added result. But as I visualized the added result, it became worse (Please see attached image (addedMeanImage.png)).
I think this was because the resize function used Image.ANTIALIAS for resizing and this changed actual the mean image values.
As the code shows, I used many steps and functions to resize the mean image.
Would there be more convenient way to resize the mean image and add to the result?
Thank you for your help!
Best Regards,
Dong Ki Kim
# IMPORT LIBRARYimport numpy as np#np.set_printoptions(threshold=np.nan)import matplotlib.pyplot as pltimport sys, caffe, os, operatorimport caffe.ioimport scipyfrom caffe.proto import caffe_pb2from PIL import Imageimport matplotlib.image as mpimg
# GLOBAL VARIABLESimagenetProbModelFile = '/home/dkkim930122/caffe-master/examples/deconvnet/imagenet_prob_deploy.prototxt'imagenetfc8ModelFile = '/home/dkkim930122/caffe-master/examples/deconvnet/imagenet_fc8_deploy.prototxt'imagenetTrainedModel = '/home/dkkim930122/caffe-master/examples/deconvnet/caffe_reference_imagenet_model'imagenetMeanFile = '/home/dkkim930122/caffe-master/examples/deconvnet/imagenet_mean.npy'
# VISSQUARE# take an array of shape (n, height, width) or (n, height, width, channels)# and visualize each (height, width) thing in a grid of size approx. sqrt(n) by sqrt(n)def visSquare(data, padsize=1, padval=0):    data -= data.min()    data /= data.max()        # force the number of filters to be square    n = int(np.ceil(np.sqrt(data.shape[0])))    padding = ((0, n ** 2 - data.shape[0]), (0, padsize), (0, padsize)) + ((0, 0),) * (data.ndim - 3)    data = np.pad(data, padding, mode='constant', constant_values=(padval, padval))        # tile the filters into an image    data = data.reshape((n, n) + data.shape[1:]).transpose((0, 2, 1, 3) + tuple(range(4, data.ndim + 1)))    data = data.reshape((n * data.shape[1], n * data.shape[3]) + data.shape[4:])        plt.imshow(data)    plt.show()
    return data
# CLASSDECONVNET# Class specific deconvnetdef classDeconvnet():    print "In classDeconvnet() function"
    # Create net (fc8)    print "Creating fc8..."    caffe.set_mode_gpu()    netfc8 = caffe.Classifier(imagenetfc8ModelFile, imagenetTrainedModel)    netfc8.set_mean('data', np.load(imagenetMeanFile))# Search the following for solution: https://github.com/BVLC/caffe/issues/420    netfc8.set_raw_scale('data', 255)    netfc8.set_channel_swap('data', (2,1,0))
    # Display Net structure (loss)    print 'Net structure (loss):'    for blobName, v in netfc8.blobs.items():
print (blobName, v.data.shape)
lastBlobName = blobName
maxIteration = 2 learning_rate = 10000 labelIndex = 100 # 100: goose
# Caffe input: zero image caffeInput = np.zeros((1,3,227,227))
# Caffe label caffeLabel = np.zeros((1,1000,1,1)) caffeLabel[0,labelIndex,0,0] = 1;
for iteration in range(maxIteration): print '< iteration at:', iteration,'>'
# forward forwardOutput = netfc8.forward(data=caffeInput) print 'forward Output is:', forwardOutput[lastBlobName][0,labelIndex,0,0] print 'forward max is :', forwardOutput[lastBlobName].max()
# backward backwardOutput = netfc8.backward(**{netfc8.outputs[0]: caffeLabel}) diff = backwardOutput['data']
caffeInput = caffeInput + learning_rate * diff # gradient ascent: http://spin.atomicobject.com/2014/06/24/gradient-descent-linear-regression/
# Normalize & visualize caffeInput caffeInput -= caffeInput.min() caffeInput /= caffeInput.max()
caffeInputVisualize = visSquare(caffeInput.transpose(0,2,3,1))# figure: notAddedMeanImage.png
# Normalize & visualize caffeInput meanImage meanImage = np.load(imagenetMeanFile) #(3,256,256) meanImage = meanImage.transpose(1,2,0) # (256,256,3)
mpimg.imsave('/home/dkkim930122/Desktop/meanImage.png', arr=meanImage, format='png')
meanImage = Image.open('/home/dkkim930122/Desktop/meanImage.png')
meanImageResize = meanImage.resize((227,227),Image.ANTIALIAS) meanImageResize.save('/home/dkkim930122/Desktop/meanImageResize.jpg', 'JPEG', quality=100)
meanImageResize = plt.imread('/home/dkkim930122/Desktop/meanImageResize.jpg') #Issue: meanImageResize(:,:,0) (:,:,1) (:,:,2) have different figure than meanImage (:,:,0) (:,:,1) (:,:,2)
meanImageResize -= meanImageResize.min() meanImageResize /= meanImageResize.max()
plt.imshow(meanImageResize) plt.show()
# Normalize & visualize meanmeanAddedImage meanAddedImage = caffeInput[0] + meanImageResize.transpose(2,0,1) #(3,227,227) + (3,227,227)
meanAddedImage -= meanAddedImage.min() meanAddedImage /= meanAddedImage.max()
plt.imshow(meanAddedImage.transpose(1,2,0)) plt.show()# figure: addedMeanImage.png
classDeconvnet()Nanne van Noord
Mar 19, 2015, 8:45:23 AM3/19/15
to caffe...@googlegroups.com
Hi, glad to hear it helped. As for adding the mean, I would either:
1. use mean_value's rather than mean_file, so you have a mean per channel, which then works independently of the image size
2. Crop the center (227x227) patch from your mean image and add that, rather than resizing it
3. Pad the 227x227 back to 256x256 and then add the mean.
If I may ask, why did you normalise the two before adding them together? I don't think anything other than adding them together and only then scaling them between 0-1 or 0-255 is needed. Some of the artefacts you see now could simply be due to normalising them before adding them together.
If I may ask, why did you normalise the two before adding them together? I don't think anything other than adding them together and only then scaling them between 0-1 or 0-255 is needed. Some of the artefacts you see now could simply be due to normalising them before adding them together.
david....@gmail.com
Jun 24, 2015, 3:51:52 PM6/24/15
to caffe...@googlegroups.com
Hi
I'm trying to reimplement aslo the paper of simonyan. could you please provide us with the files
imagenetProbModelFile = '/home/dkkim930122/caffe-master/examples/deconvnet/imagenet_prob_deploy.prototxt'
imagenetfc8ModelFile = '/home/dkkim930122/caffe-master/examples/deconvnet/imagenet_fc8_deploy.prototxt'
imagenetTrainedModel = '/home/dkkim930122/caffe-master/examples/deconvnet/caffe_reference_imagenet_model'
imagenetMeanFile = '/home/dkkim930122/caffe-master/examples/deconvnet/imagenet_mean.npy'
to be able to run your code? I'm rather new in this area.
this is the code that I'm using but still have problem in visualization.
I used the code by by Yangqing Jia which used for visualization of filters.
thanks if you can help me. I want to take a output as good as theirs for saliency map. but I guess I got sth wrong
import numpy as np
import scipy.misc
import matplotlib.pyplot as plt
import matplotlib.cm as cm
import matplotlib.image as mpimg
#%matplotlib inline
# Make sure that caffe is on the python path:
caffe_root = '/BS/home-11/azimi/Documents/caffe/' # this file is expected to be in {caffe_root}/examples
import sys
sys.path.insert(0, caffe_root + 'python')
import caffe
plt.rcParams['figure.figsize'] = (10, 10)
plt.rcParams['image.interpolation'] = 'nearest'
plt.rcParams['image.cmap'] = 'gray'
import os
caffe.set_mode_cpu()
net = caffe.Net(caffe_root + 'models/bvlc_reference_caffenet/deploy.prototxt',
caffe_root + 'models/bvlc_reference_caffenet/bvlc_reference_caffenet.caffemodel',
caffe.TRAIN)
# input preprocessing: 'data' is the name of the input blob == net.inputs[0]
transformer = caffe.io.Transformer({'data': net.blobs['data'].data.shape})
transformer.set_transpose('data', (2,0,1))
transformer.set_mean('data', np.load(caffe_root + 'python/caffe/imagenet/ilsvrc_2012_mean.npy').mean(1).mean(1)) # mean pixel
transformer.set_raw_scale('data', 255) # the reference model operates on images in [0,255] range instead of [0,1]
transformer.set_channel_swap('data', (2,1,0)) # the reference model has channels in BGR order instead of RGB
net.blobs['data'].reshape(1,3,227,227)
net.blobs['data'].data[...] = transformer.preprocess('data', caffe.io.load_image(caffe_root + 'examples/images/galaxy.jpg'))
out = net.forward()
print("Predicted class is #{}.".format(out['prob'].argmax()))
#image = net.blobs['data'].data[...]
#vis_square(image.transpose(0, 2, 3, 1))
backwardOutput = net.backward()
filters = net.blobs['data'].diff #(1, 3, 227, 227)
data = filters.transpose(0, 2, 3, 1) #(1, 227, 227, 3)
# take an array of shape (n, height, width) or (n, height, width, channels)
# and visualize each (height, width) thing in a grid of size approx. sqrt(n) by sqrt(n)
data -= data.min()
data /= data.max()
padsize=1
padval=0
# force the number of filters to be square
n = int(np.ceil(np.sqrt(data.shape[0])))
padding = ((0, n ** 2 - data.shape[0]), (0, padsize), (0, padsize)) + ((0, 0),) * (data.ndim - 3)
data = np.pad(data, padding, mode='constant', constant_values=(padval, padval))
# tile the filters into an image
data = data.reshape((n, n) + data.shape[1:]).transpose((0, 2, 1, 3) + tuple(range(4, data.ndim + 1)))
data = data.reshape((n * data.shape[1], n * data.shape[3]) + data.shape[4:])
bw = np.zeros((228,228))
bw = data.max(axis=2)
bw /= (bw.max()/255.0)
print 'bwmaxscaled',bw.max()
bw [bw < 150]=0
plt.imshow(data)
plt.imshow(bw)
"""
for i in range(10):
output = image-np.multiply(np.divide(filters*i,10),image)
vis_square(output.transpose(0, 2, 3, 1))
plt.imshow(transformer.deprocess('data', net.blobs['data'].data[0]))
Caffe User
Jun 29, 2015, 11:23:27 AM6/29/15
to caffe...@googlegroups.com
Hello.
Thank you Nanne van Noord again! Your advice greatly helped me!
David, here are the files you requested.
Please download them from the following link: https://www.dropbox.com/sh/4nb6yafv302gkpr/AAANYTeNSeBsVSGU5HRP5fYxa?dl=0
Additionally, in this paper (http://arxiv.org/pdf/1412.1897v4.pdf), they also produced the deconvnet image (please refer to section 3.9 in the paper).
And their source could be found in this link: http://www.evolvingai.org/fooling.
I haven't tried the source code yet, but I believe it will be a good reference!

CJ Barberan
Jul 4, 2015, 5:16:56 PM7/4/15
to caffe...@googlegroups.com
Hello,
I was trying to use your code to test it to replicate the results, yet in the backward method, I keep getting an error saying that input array from shape (1000,1,1) into shape (1,1000). I was wondering if you had experienced that error beforehand?
-CJ
David
Jul 6, 2015, 5:44:18 AM7/6/15
to caffe...@googlegroups.com
Hi,
@CS Barberan. you should change the order of dimension I also faced with such a problem and by changing the order of dimension the error was solved.
Caffe User
Jul 8, 2015, 9:50:50 PM7/8/15
to caffe...@googlegroups.com
Hello. As I was reviewing the code, I found some issues and revised the code.
Here are the major changes that I made:
1. For label index, I made a big mistake by not subtracting 1 (Python's index starts from 0). I fixed this in the code.
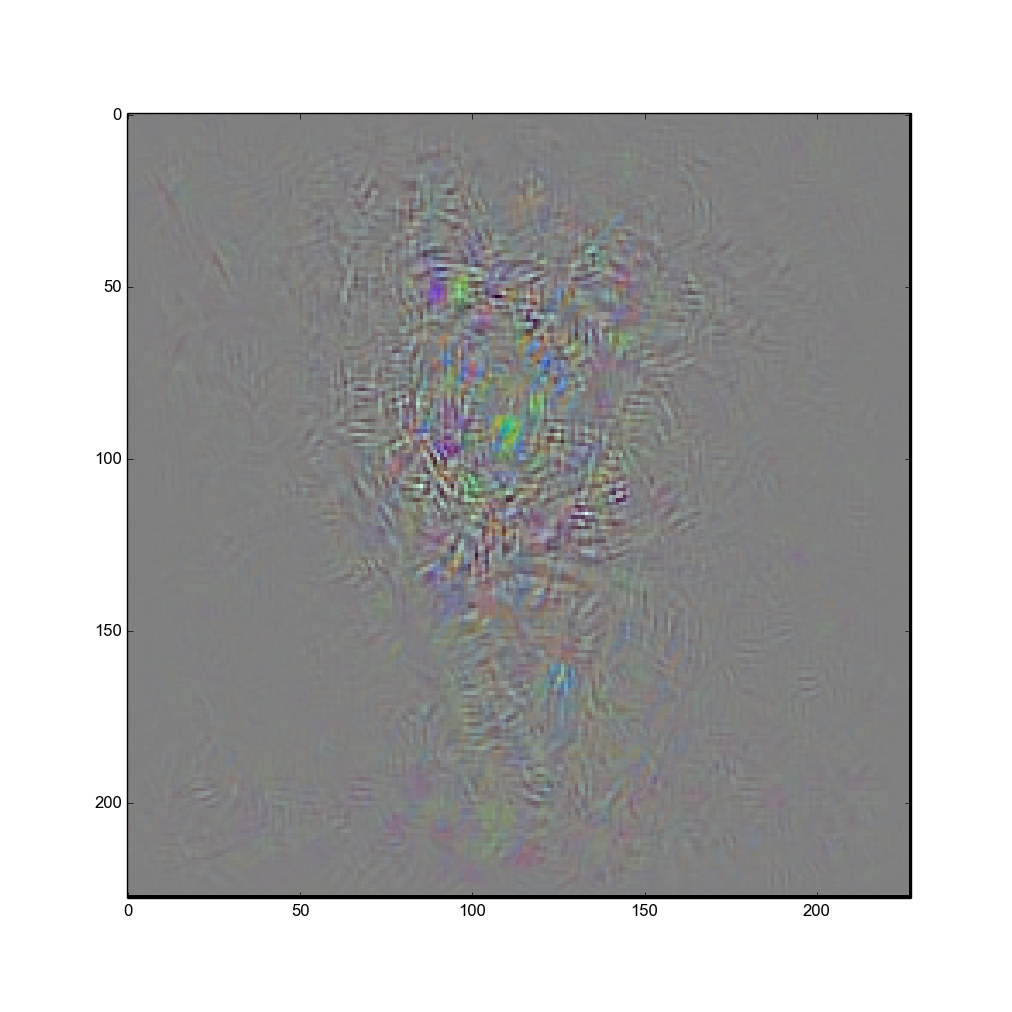
2. I followed Nanne Van Noord's advice and cropped the the center (227x227) patch from the mean image and added it to visualize the deconvnet image.
The result for dumbbell is shown in the attached image.
If there are changes needed to be made or there are somethings that I am doing wrong, I would appreciate if you could point them out.
Thank you!
Note: please note that I am using the latest caffe-master version (which might affect some syntax change depending on the caffe version).
# IMPORT LIBRARY
import numpy as np
import matplotlib.pyplot as plt
import sys, caffe, os, operator
import caffe.io
from caffe.proto import caffe_pb2
from PIL import Image
import matplotlib.animation as animation
# GLOBAL VARIABLES
imagenetfc8ModelFile = '/home/dkkim930122/caffe-master/examples/deconvnet/imagenet_fc8_deploy.prototxt'
imagenetTrainedModel = '/home/dkkim930122/caffe-master/models/bvlc_reference_caffenet/bvlc_reference_caffenet.caffemodel'
imagenetMeanFile = '/home/dkkim930122/caffe-master/examples/deconvnet/imagenet_mean.npy'
# Set parameters
maxIteration = 250
learning_rate = 12500
labelIndex = 544 # 100: goose, 281: cat, 544: dumbbell
labelIndex = labelIndex-1
# CLASS DECONVNET
def classDeconvnet():
print "In classDeconvnet() function"
# Create net (fc8)
caffe.set_mode_cpu()
netfc8 = caffe.Classifier(imagenetfc8ModelFile, imagenetTrainedModel,
mean=np.load(imagenetMeanFile).mean(1).mean(1),
channel_swap=(2,1,0),
raw_scale=255,
image_dims=(256, 256))
# Display Net structure (fc8)
print 'Net structure (loss):'
for blobName, v in netfc8.blobs.items():
        print (blobName, v.data.shape)
    lastBlobName = blobName
# Define caffe input: zero image
    caffeInput = np.zeros((1,3,227,227))


    # Caffe label
    caffeLabel = np.zeros((1,1,1,1000))# for SIGMOID_CROSS_ENTROPY_LOSS (https://groups.google.com/forum/#!searchin/caffe-users/SIGMOID_CROSS_ENTROPY_LOSS/caffe-users/19XfmJqg34Q/Id_jnm_L0iIJ)
    caffeLabel[0,0,0,labelIndex] = 1;


    # Define array for storing forwardOutput (used for chaning lr)
    storeForwardOutput = np.array([])


    # load mean image and center crop
    meanImage = np.load(imagenetMeanFile) #(3,256,256)
    cropMeanImage = meanImage[:,14:241,14:241]# Center crop


    for iteration in range(maxIteration):
        print '< iteration at:', iteration,'>'


        # forward
        forwardOutput = netfc8.forward(data=caffeInput)
        storeForwardOutput = np.append(storeForwardOutput,forwardOutput[lastBlobName][0,labelIndex])
        print 'forward Output is:', forwardOutput[lastBlobName][0,labelIndex]
print 'forward max is :', forwardOutput[lastBlobName].max()
        print 'learning_rate is :', learning_rate


        # # After some iteration, reduce lr if forward output change is small
        # if iteration > 50:
        #     if abs(storeForwardOutput[-1] - storeForwardOutput[-2]) < 1:
        #         learning_rate = learning_rate * 0.99


        # backward
        backwardOutput = netfc8.backward(**{netfc8.outputs[0]: caffeLabel})
        diff = backwardOutput['data']


        # Check if diff is zero. If yes, then break
        if np.linalg.norm(diff) == 0:
            print 'ERROR: diff norm is zero! Not good deconvnet parms!'
            break;
caffeInput = caffeInput + learning_rate * diff # gradient ascent: http://spin.atomicobject.com/2014/06/24/gradient-descent-linear-regression/
        addedImage = caffeInput[0] + cropMeanImage


        addedImage -= addedImage.min()
        addedImage /= addedImage.max()


        plt.imshow(addedImage.transpose(1,2,0))
        plt.savefig(str(iteration) + '.png', bbox_inches='tight')


    # Final iteration image visualization
    addedImage = caffeInput[0] + cropMeanImage


    addedImage -= addedImage.min()
    addedImage /= addedImage.max()


    plt.imshow(addedImage.transpose(1,2,0))
    plt.show()


classDeconvnet()
ngc...@gmail.com
Sep 3, 2015, 4:46:27 AM9/3/15
to Caffe Users
Is the Imagenet dataset (converted to lmdb) required to run the code?
CJ Barberan
Sep 3, 2015, 9:08:08 AM9/3/15
to ngc...@gmail.com, Caffe Users
Nope, you just need the deploy.prototxt and the ().caffemodel. The lmdb is only needed for the training aspect.
To view this discussion on the web visit https://groups.google.com/d/msgid/caffe-users/6f77537e-719f-41be-a408-66e8ad794162%40googlegroups.com.--
You received this message because you are subscribed to a topic in the Google Groups "Caffe Users" group.
To unsubscribe from this topic, visit https://groups.google.com/d/topic/caffe-users/5iwXJ3NmHJA/unsubscribe.
To unsubscribe from this group and all its topics, send an email to caffe-users...@googlegroups.com.
To post to this group, send email to caffe...@googlegroups.com.
ngc...@gmail.com
Sep 4, 2015, 2:38:45 AM9/4/15
to Caffe Users
Thanks for the info.
Since the link above is unavailable, I managed to figure out what to put in deploy.prototxt. Starting with the deploy file for CaffeRefNet- changed batch size (first input_dim) to 1, added force_backward:true and removed layer 'prob'. Hopefully that is correct. I got an image similar to above (though not exactly identical.)

Dixon Dick
Sep 4, 2015, 5:28:11 AM9/4/15
to Caffe Users
Thanks for pointing this out. But where is CaffeRefNet? Or better, can these be posted in a gist?
dcd
ngc...@gmail.com
Sep 7, 2015, 12:47:08 AM9/7/15
to Caffe Users
I used deploy.prototxt from directory models/bvlc_reference_caffenet/ (unfortunately I haven't got down to learning Git.)
These are the first few lines.
name: "CaffeNet"input: "data"input_dim: 1input_dim: 3input_dim: 227input_dim: 227force_backward: true
This is followed by the same layers definitions, except the last, softmax layer ('prob') is deleted
Hopefully, while it works, it is also correct (my little knowledge is a dangerous thing).
Reply all
Reply to author
Forward
0 new messages