|
|
Summer 2023 in Review
A Look Back at Drought Across the U.S. in 10 Maps
|
|
|
|
We’re just days away from turning the page from summer to fall. Drought in the United States expanded in Summer 2023, driven by lack of rain, extreme heat, and evaporative demand.
The first U.S. Drought Monitor of Summer 2023, issued on June 27, 2023, showed the worst drought in the U.S. on the Central Plains and into the Midwest. Other areas in drought included the Northwest, Mid-Atlantic, and smaller pockets in Hawaii, the Southwest,
and Texas, although one of these pockets in Texas included Extreme/Exceptional Drought (D3-D4). Overall, 22.6% of the U.S. was in drought. Fast forward to this week’s U.S. Drought Monitor, which will be the last of Summer 2023. In general, areas in drought
stayed in drought or worsened, and new drought developed. The areas hit worst this summer were afflicted with little rain and a lot of extreme heat. This particularly applies to NM across to AL, including TX, LA, and MS. While conditions improved a bit on
the Central Plains, Midwest, and in the Mid-Atlantic, conditions deteriorated further in the Northwest, Upper Midwest, and Hawaii. Overall, 31.7% of the U.S. is in drought.
With fall around the corner, drought along the Mississippi River Basin and worsening conditions in the Ohio River Basin may impact shipping on the Mississippi River. See how drought
progressed across Summer 2023 with these 10 maps showing precipitation, temperature, evaporative demand, wildfires, and more.
|
|
|
Expect a Strong El Niño Winter
|
|
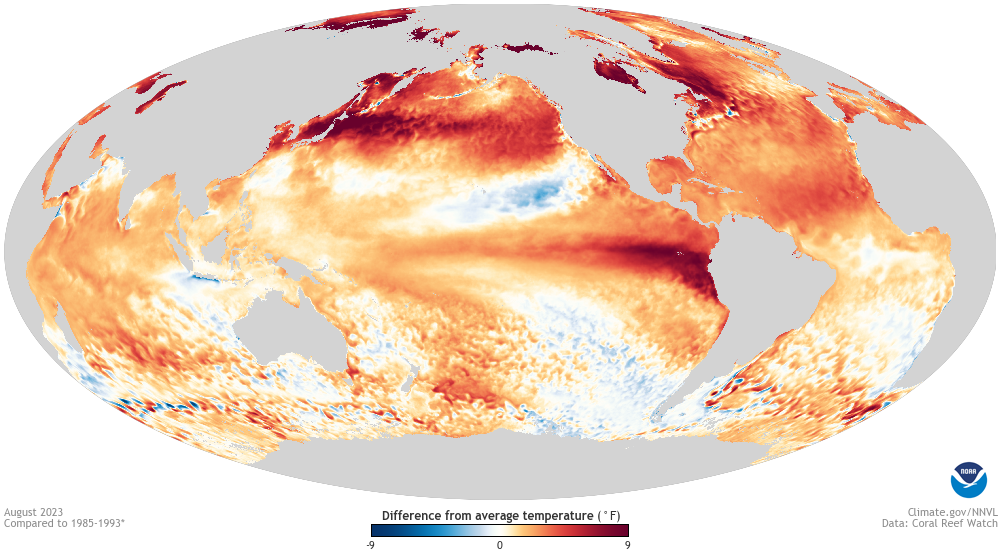
According to the September El Niño-Southern Oscillation (ENSO) Outlook, El Niño is expected to stick around (with greater than a 95% chance) at least through January-March 2024.
There is around a 71% chance this event peaks as a strong El Niño this winter. The Climate.gov ENSO blog “interviewed” the Pacific Ocean and tropical atmosphere to learn more about characteristics of this El Niño cycle: very warm ocean temperatures and an
El Niño-influenced precipitation pattern.
Learn
more >
|
|
|
September Climate and Health Outlook
|
|
The September 2023 Climate and Health Outlook explores the climate-related health hazards of extreme heat, wildfire, and drought. These monthly outlooks are produced by the Department
of Health and Human Services (HHS) Office of Climate Change and Health Equity (OCCHE), with input from NIDIS and other partners. Current hazards include extreme heat, drought, and wildfire.
Learn
more
>
|
|
Soil Moisture Data to Support Managing Forests
|
|
The National Soil Moisture Workshop is the premier event for sharing soil moisture research and applications. This year's workshop featured discussions on how improved soil moisture
monitoring can support forest, grassland, and other land management. There were also discussions on soil moisture networks, data quality, remote-sensing, modeling, and more. Watch the workshop recap.
Learn
more
>
|
|
|
FEATURED MAPS + DATA
August 2023 Streamflow
|
|
|
Low streamflows impacted the Pacific Northwest, Midwest, Mid-Atlantic, and Southern United States in August. Parts of New England saw wetter than average conditions.
Each tile below shows the percent of stream gauges by flow level, using percentiles relative to the historic record at each site. These data show if current conditions are wetter
or drier than each site has experienced in the past. Check out more data visualizations
at
USGS's Vizlab blog.
View
more streamflow data
>
|
|
|
NIDIS Drought Alert Emails: Get Local Drought Conditions and Outlooks in Your Inbox
|
|
Get automated email alerts from NIDIS when U.S. Drought Monitor conditions change for your location, or when NOAA’s Climate Prediction Center releases a new drought outlook, predicting
whether drought will remain, develop, improve, or be removed. Sign
up here >
|
|
Sign Up for the NIHHIS Heat Beat Newsletter
|
|
The Heat Beat newsletter, by NOAA's National Integrated Heat Health Information System (NIHHIS), provides information on extreme urban heat in communities across the U.S. Subscribers
will get ideas for running and publicizing heat-mapping campaigns and learn ways urban heat issues can be addressed.
Sign
up here >
|
|
Dry Times will come out on Wednesdays starting Oct. 18.
Starting Oct. 18, Dry Times will be released every other Wednesday.
|
|
|
UPCOMING
Events & Webinars
|
|
About NIDIS
The National Oceanic and Atmospheric Administration’s (NOAA) National Integrated Drought Information System (NIDIS) was authorized by Congress in 2006
(Public Law 109-430) with an interagency mandate to develop and provide a national drought early warning information system, by coordinating and integrating drought research, and building upon existing federal, tribal, state, and local partnerships.
|
|
|
|
|