The Slave Trade and the Industrial Revolution Debate: A Look at the Numbers

S. E. Anderson
The Slave Trade and the Industrial Revolution Debate: A Look at the Numbers
Although they make a very strong case for it, Berg and Hudson assert that their findings and the research reviewed in their book do not prove that slavery is the major factor behind the Industrial Revolution—though slavery did help to change dramatically and develop many urban areas within Britain.6 Like most of the scholarly literature cited in the book, they emphasize and conclude that the biggest factor that the slave trade plays in economic development is solely at the urban and regional levels for some parts of England and Scotland, as well as for certain industries located there. They stop short of national implications of the slave trade. Despite this, there are some who still claim that the slave trade plays very little to no role in the Industrial Revolution at any level of economic activity, such as the historian Lawrence Goldman and economist Kristian Niemietz, who have been critical of Berg and Hudson.7 Yet, some recent empirical works do show national-level economic linkages of the slave trade with the finding that the slave trade is a major factor, if not the major factor, in the Industrial Revolution. Stephan Heblich, Stephen J. Redding, and Hans-Joachim Voth show a relationship between payments to slavers as part of Britain’s Abolition of Slavery Act of 1833 and the subsequent significant rise in industrial activity in the regions where there is the greatest amount of slaver interests. Their study proceeds from the urban and regional levels up to a national one. The overall conclusion is that the proceeds of the payments were used to invest in industries, and this investment led the Industrial Revolution to greater heights.8 Using my own working papers, in addition to outside databases and concepts appearing in my two previous articles for Monthly Review, the connections between the slave trade and the Industrial Revolution become clear.9
Over the last twenty years or so, two large datasets have been developed that give sophisticated conjectures on the growth and development of the British economy from the thirteenth to nineteenth centuries. Gregory Clark and, later, a group of economic historians—including Stephen Broadberry, Bruce M. S. Campbell, Alexander Klein, Mark Overton, and Bas van Leeuwan—have calculated and posted estimates of various types of national economic aggregates such as Gross Domestic Product (GDP), net national income (NNI), price indices, and so on, as well as approximations for the economic activity of various industries, labor wages, and population estimates over the centuries for Britain.10 Since 1999, data for the slave trade going back to the 1500s have been available on the Transatlantic Slave Trade Database. The value of new enslaved persons sold in the Americas can be obtained from U.S. Census Bureau records.11 Going further, data from actual historical records are in British Historical Statistics by B. R. Mitchell, which lists in tables the output of different industries and goods and services such as sugar, tin, iron; the values of exports and imports; and public finance amounts, among other records for Britain and Ireland. In many cases, these go as far back as the final decade of the seventeenth century.12 These databases, as well as the ones I have constructed and used in this and other papers and articles, are employed in some of the charts that follow, and others are posted in the longer working paper from which this essay is derived.13
The Slave Trade Database shows the number of enslaved persons who disembarked from ships carrying the British flag for each year from 1563 to 1809. These total over two million enslaved persons. There are zero values for the years from 1569 to 1640, a time period that saw the unsuccessful use of indentured servants, so there is not a time series of data until 1641 and onward. Because legal trans-Atlantic slavery ended after 1807, the numbers of disembarked enslaved persons for 1808 and 1809 fall dramatically, which causes extreme values or outliers for any type of graphical or statistical analyses.14 Therefore, values from 1641 to 1807 are predominantly used in the majority of the charts here, although longer-term trends can be shown by going back to 1563 in some instances. Because the data from Mitchell usually only date back to the last decade of the seventeenth century or around the first decade of the eighteenth century, some of these charts examine data related to the eighteenth and early nineteenth centuries. Finally, it is well known in the field of econometrics that some relationships between two variables that span long time periods may be deemed as “spurious.” This is sometimes the case with variables that are “non-stationary” or, in other words, when variables show similar trends. Often, it may appear that one variable is affecting or connected to another, when in actuality, a third may be an intermediary, offering a better explanation for the relationship. For this paper, statistical tests have been done to show that although almost all of the variables displayed are non-stationary, each pair of variables displayed in the graphs are still statistically “co-integrated,” meaning that their relationships or correlations are considered non-spurious and stable.15
Berg and Hudson, as well as Williams, give an outline of the pathways and linkages among different industries and events, which are displayed in Diagram 1. The slave trade helps to develop the sugar, textiles (via cotton), coffee, tobacco, and the banking and finance industries (via financing of overseas trade and operations). The growth of these industries in turn spur the demand for more enslaved persons, thereby creating a recursive and growing cycle of commerce across the Atlantic Ocean. The growth of these industries then leads to greater demand for metals, leading to increased mining for tin and iron; more demand for coal; and, with greater goods being produced, greater shipping and transportation needs. As these industries grow, so does the demand for labor that traditionally worked on farms, but moved to urban areas as a result of enclosure movements that displaced people from their land. Finally, the confluence of the growth of these industries lead to greater investment, output, and income in the British economy.
Diagram 1. Historical Linkages of the Slave Trade
For an analysis of the economic impact of the slave trade, it is useful to estimate how much the profits of different enterprises and industries grew at the macroeconomic level during the seventeenth, eighteenth, and early nineteenth centuries. Tax revenues collected by all levels of government can be added to these business rents, net interest, and profits to get at some estimate of what Paul A. Baran and Paul M. Sweezy named the economic surplus, a concept that shows what is produced and earned beyond what is paid to labor and accruing to the capitalist class.16 Baran and Sweezy included as part of the economic surplus not just profits, rents, net interest, and taxes, but also wasteful business and governmental expenditures on advertising, marketing, and military spending. Unfortunately, many databases do not detail such wasteful spending, except for perhaps military spending. Nevertheless, even while not being able to account for waste, concrete measurement of the reinvestment of the economic surplus from rising business profits and rents (and captured in increased tax revenues) allows us to compare this to the expansion of the slave trade and its related industries.17 One of the main debates over whether the slave trade matters to the Industrial Revolution is over how much and to what degree proceeds from it and the industries that it supported benefited from overall investment (private and public) out of the economic surplus at the national level, making the Industrial Revolution possible. The rate at which investment comes from the economic surplus has been designated as the Baran Ratio.18
The charts found here link to Diagram 1 in the following ways. Chart 1 displays the trends in the slave trade and the inflation adjusted value of sugar imports, much of which is later exported after being processed, from the 1700s to 1807. When performing a statistical technique called regression, the “fit” or degree of correlation between the two variables is strong, with an almost 70 percent fit. When looking at enslaved people disembarking only in the West Indies, where most of the sugar industry was concentrated in the Americas, the fit is still strong, at around 66 percent. The charts in this paper typically underly fits between two variables or factors that are moderate to strong and are considered co-integrated according to diagnostic tests. As can be seen in Chart 1, both variables move up closely together, except when both drop during the U.S. American Revolution, though they subsequently rebound. According to the literature, the sugar trade is one of the major catalysts for the food processing, metal, and transportation industries, since sugar imports trigger the demand for a greater amount of baked goods, cooking utensils, and the shipment of finished food goods by land and sea. Coffee shows similar effects between trade and output, although to a slightly lesser degree.19 This weaker fit for coffee is possibly because, according to some sources, goods such as coffee and tobacco are less labor-intensive than sugar. Thus, one would expect the greatest amount of enslaved labor to be used for sugar production, rather than for coffee and tobacco, although after introduction of the cotton gin, the demand for enslaved labor increased dramatically for that industry.20 The Slave Voyage Database states that the total number of enslaved persons used in the production of sugar is around 5.25 million, whereas the number used for cotton, tobacco, rice, cacao, etc., total only 1.5 million by comparison.21 The total number of enslaved persons who disembarked under the British flag according to the Slave Voyage Database is probably the best series of data over time available, although this database does not indicate how many go on to sugar plantations versus those of cotton, coffee, tobacco, and so on. The better fits between total enslaved persons disembarked (an aggregate number) and sugar and cotton production, respectively, can probably be explained by most enslaved labor in the eighteenth and nineteenth centuries being used for sugar and cotton production, and less so for coffee and tobacco.
Chart 1. Sugar Imports and Disembarked Slaves, 1700–1807
Chart 2. Textiles Output Index and Disembarked Enslaved Persons, 1563–1807
Sources and Notes: Data from the Trans-Atlantic Slave Trade Database and Stephen Broadberry et al., British Economic Growth, 1270–1870 (Cambridge: Cambridge University Press, 2015). Textiles output index is calculated using the year 1700 as a benchmark (1700 = 100).
Corresponding to the second level (from the bottom) of Diagram 1, Chart 3 shows the relationship between enslaved persons disembarked and an index of the demand for food processing.22 The degree of fit between enslaved labor and the food processing index is around 67 percent, a somewhat strong correlation. Food processing, as well as the production of tin and other metals are commodities and industries that underwent rapid growth in Britain after the large influx of sugar, coffee, and tobacco imports in the nation, This, in turn, created a demand for cooking utensils and equipment and, because of the need for more manufacturing and production machinery such as ovens and other equipment used to make more food items, textiles and other goods. In my working paper, a chart displays how the slave trade trends with tin production. This shows a 67 percent fit or correlation between the two. Coal is also important to the Industrial Revolution, as more is needed for hearths, metal making, and so on.23
Chart 3. Food Processing Output Index and Disembarked Enslaved Persons, 1641–1807
Sources and Notes: For data, see Chart 2. Food processing output index is calculated using the year 1700 as a benchmark (1700 = 100).
Chart 4 illustrates how the slave trade and the expansion of canals, ports, and roads develop over time, as illustrated by an estimated trade and transportation index adapted from a database compiled by Broadberry and colleagues. Many have written that domestic trade within Britain expanded during the time of the slave trade and the Industrial Revolution, as did the need for more and better canals, roads, and turnpikes. The fit here is a strong one, at around 81 percent. During medieval times, much of Britain’s road network dated back to the time of Roman occupation, and, during most of the eighteenth century, the nation went on a massive public works initiative.24 Importantly, the greatest upturns in these industries and enterprises occurred during the time of the Industrial Revolution, corresponding to the strongest period of the slave trade, with the exception of the period of the American Revolution.
Chart 4. Trade and Transport Index and Disembarked Enslaved Persons, 1563–1807
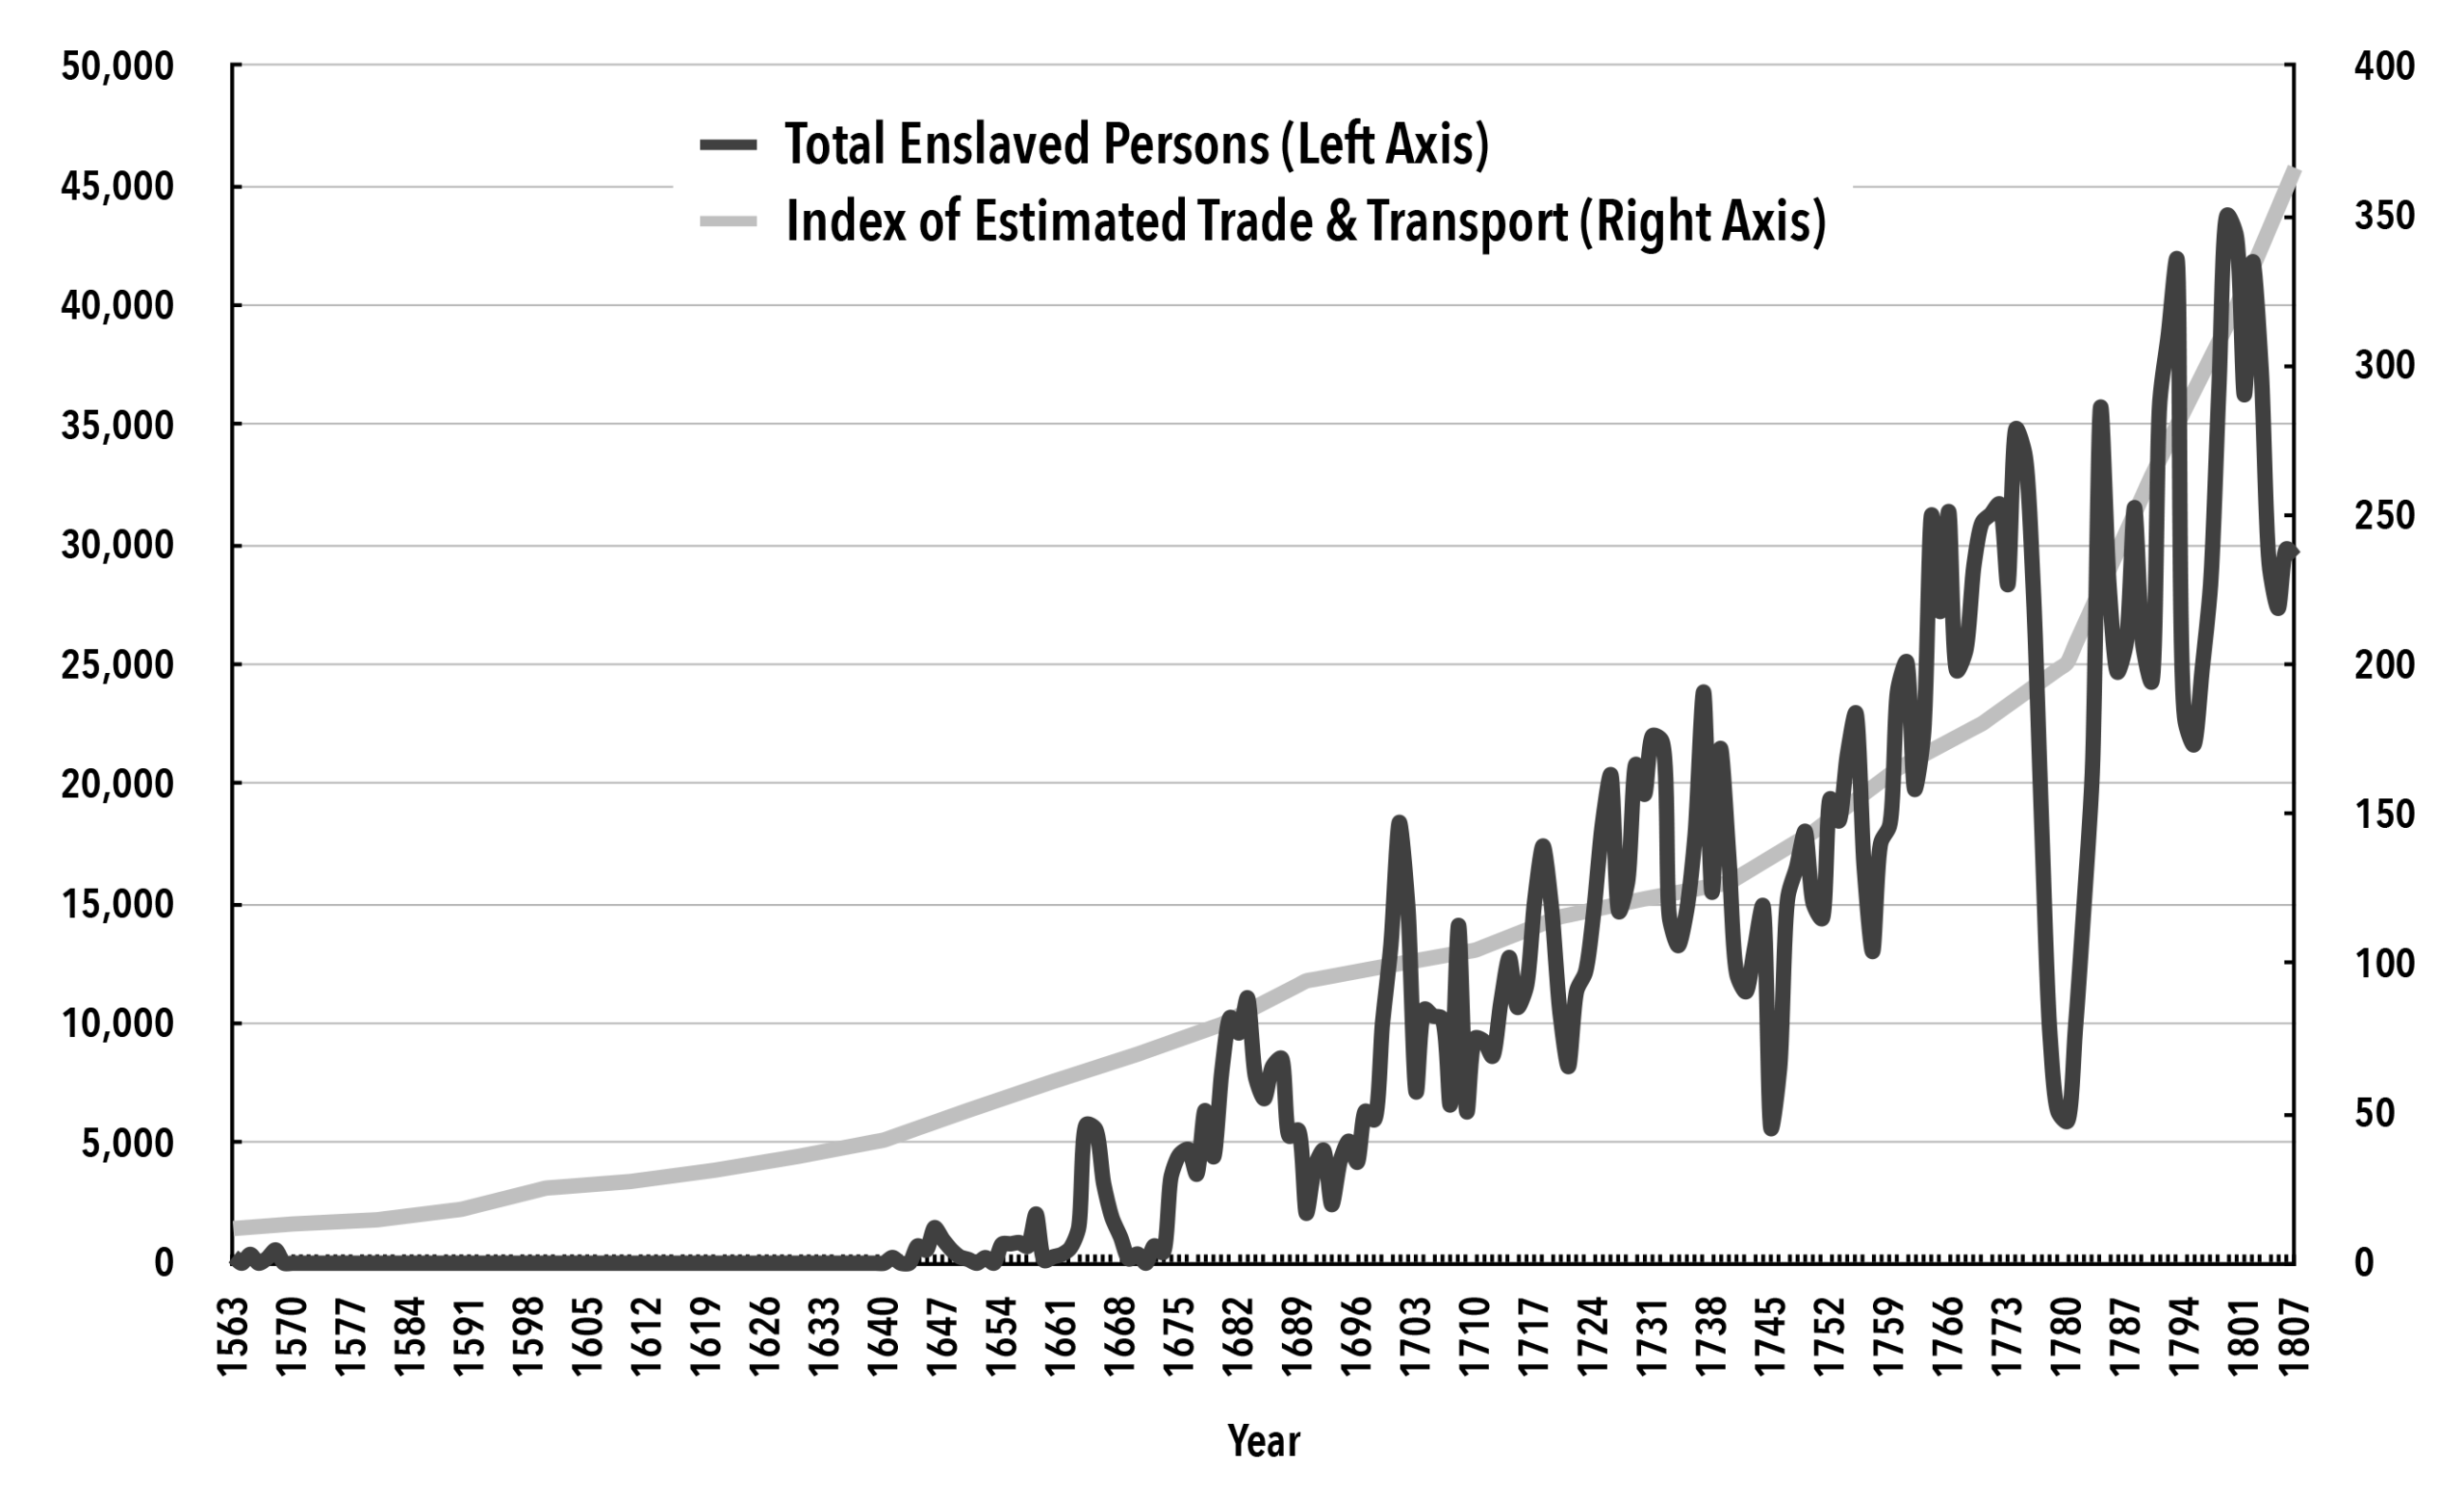
Sources and Notes: For data, see Chart 2. Estimated trade and transport index is calculated using the year 1700 as a benchmark (1700 = 100).
Corresponding to the lowest level of Diagram 1, Chart 5 addresses Marx’s assertion that wage labor is built on the pedestal of enslaved labor. Instead of only going back to 1641 or 1700, the chart begins at 1563, the furthest time possible in the Transatlantic Slave Trade Database, to show how male, nonfarm labor was 30 and 40 percent of the labor force during the sixteenth and seventeenth centuries. (Note: given deficiencies with respect to the data on the employment of women and children in the period, historical statistics customarily rely on trends in adult male labor alone, standing in for total labor.) As it reached its peak years in the late eighteenth century, the period that many note as the beginning of the Industrial Revolution, nonfarm workers (in terms of adult males) become 50 to 60 percent of the labor force. The strength of the fit between these two variables is around 62 percent. The industries that commenced and developed thanks to the slave trade needed workers to process and refine more and more sugar, coffee, and tobacco; mine coal; mine tin and copper and create iron; labor on public works projects; and help haul goods to markets to and from growing seaside ports. These industries, helped by the slave trade, made Britain’s labor force an industrial one, while the farm workforce shrank in comparison.25
Chart 5. Nonfarm Labor Force and Disembarked Enslaved Persons, 1563–1807
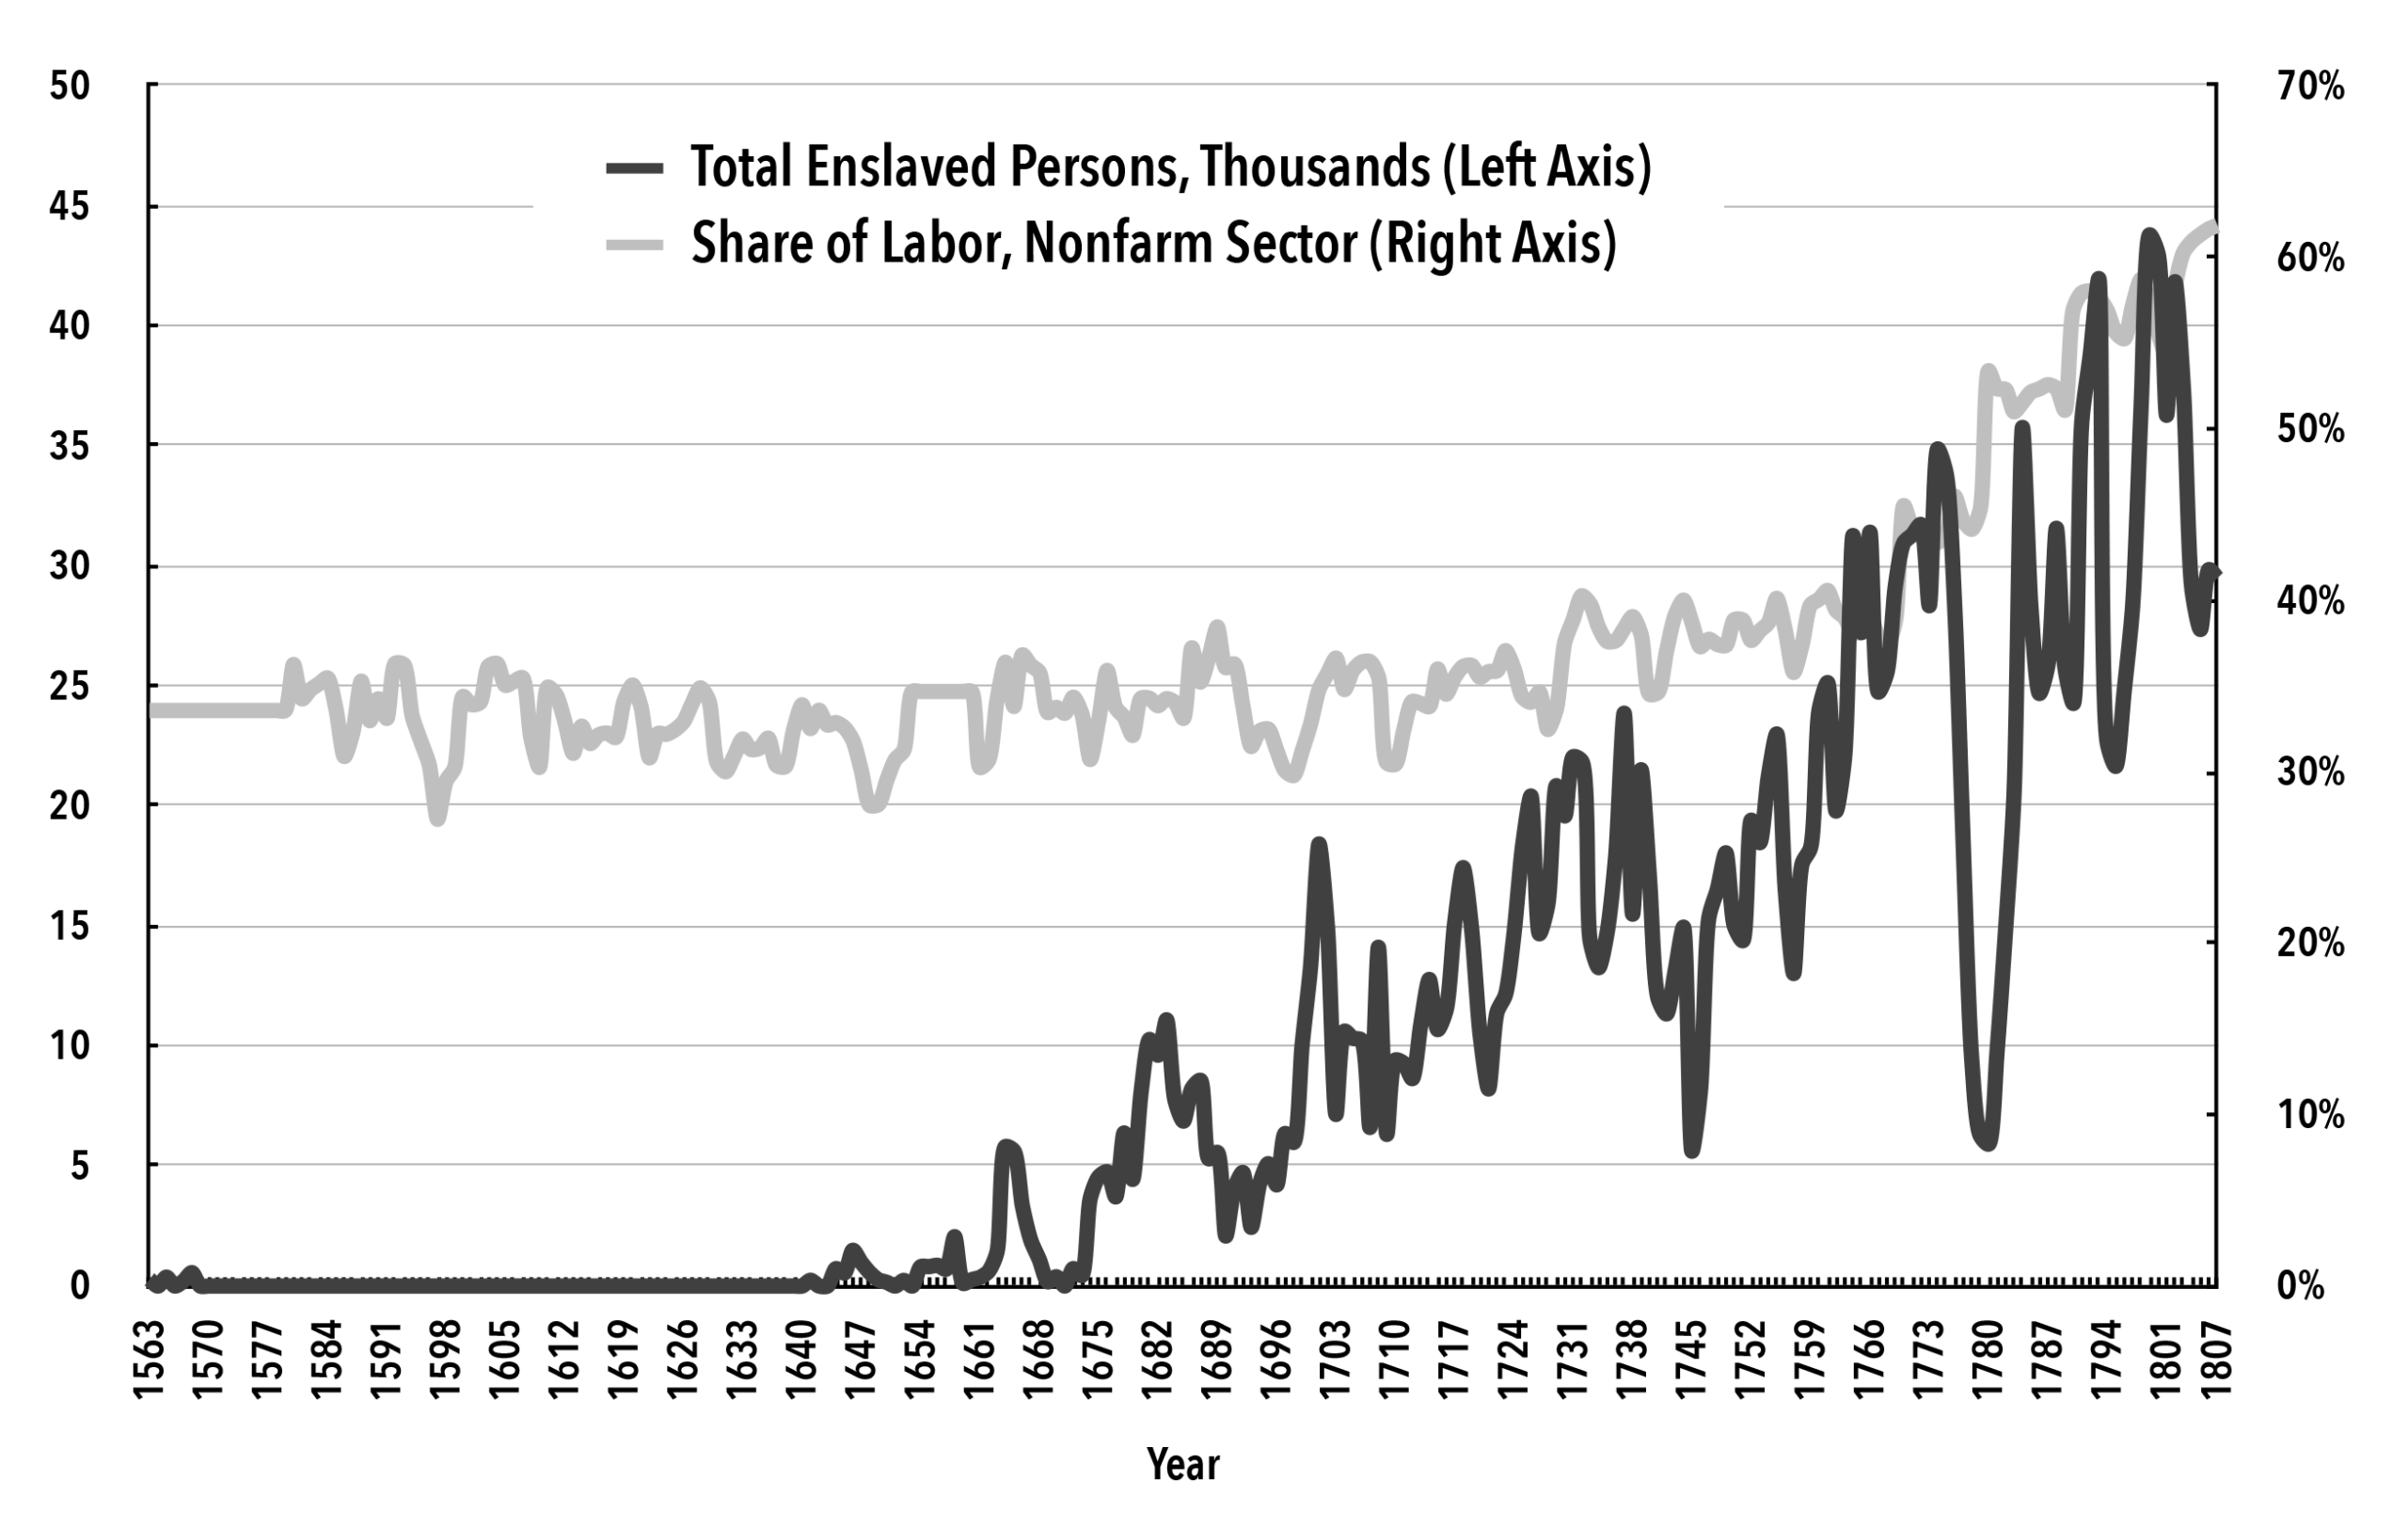
Sources and Notes: Data from Trans-Atlantic Slave Trade Database and Gregory Clark, “The Macroeconomic Aggregates for England, 1209–2008,” Economics Working Paper 09-19, University of California, Davis, 2009. The statistics from the time provide reliable data only for adult male labor, which is used as a surrogate for labor as a whole. It should be observed, though, that in the British Industrial Revolution, women and children constituted the majority of workers in the textile industry at the heart of industrialization. See Joyce Burnette, “Women Workers in the British Industrial Revolution,” Economic History Association, eh.net.
Chart 6 illustrates how the economic surplus per capita, or the total of the estimates of domestic rents, profits, and taxes collected per person, rise with the slave trade. This is especially the case during the eighteenth century. Here the fit correlation between these two variables is around 50 percent. When it comes to public investment in roads, turnpikes, bridges, and infrastructure, Chart 7 plots how estimated public investment rose dramatically with the slave trade. The fit between these two factors is around 70 percent. Similar to the other charts displayed, the biggest increases of both trends typically took place around the time of the Industrial Revolution. Finally, and perhaps most importantly at the macroeconomic level, a real GDP per capita index constructed by Broadberry and his coauthors rises with the total number of enslaved persons disembarked from 1563 to 1807. The econometrics show this relationship as strongly correlated and non-spurious, with a fit of around 79 percent (see Chart 8). The year 1563 is used as a starting point in order to show that before the slave trade rose rapidly in the mid-seventeenth century the real UK GDP per capita index stayed fairly constant, between 60 and 80. This index then grew more rapidly than during subsequent decades, and especially during the time period of the Industrial Revolution. There appears to be a strong connection between the slave trade and Britain’s economic growth.
Chart 6. Economic Surplus per Capita and Disembarked Enslaved Persons, 1641–1807
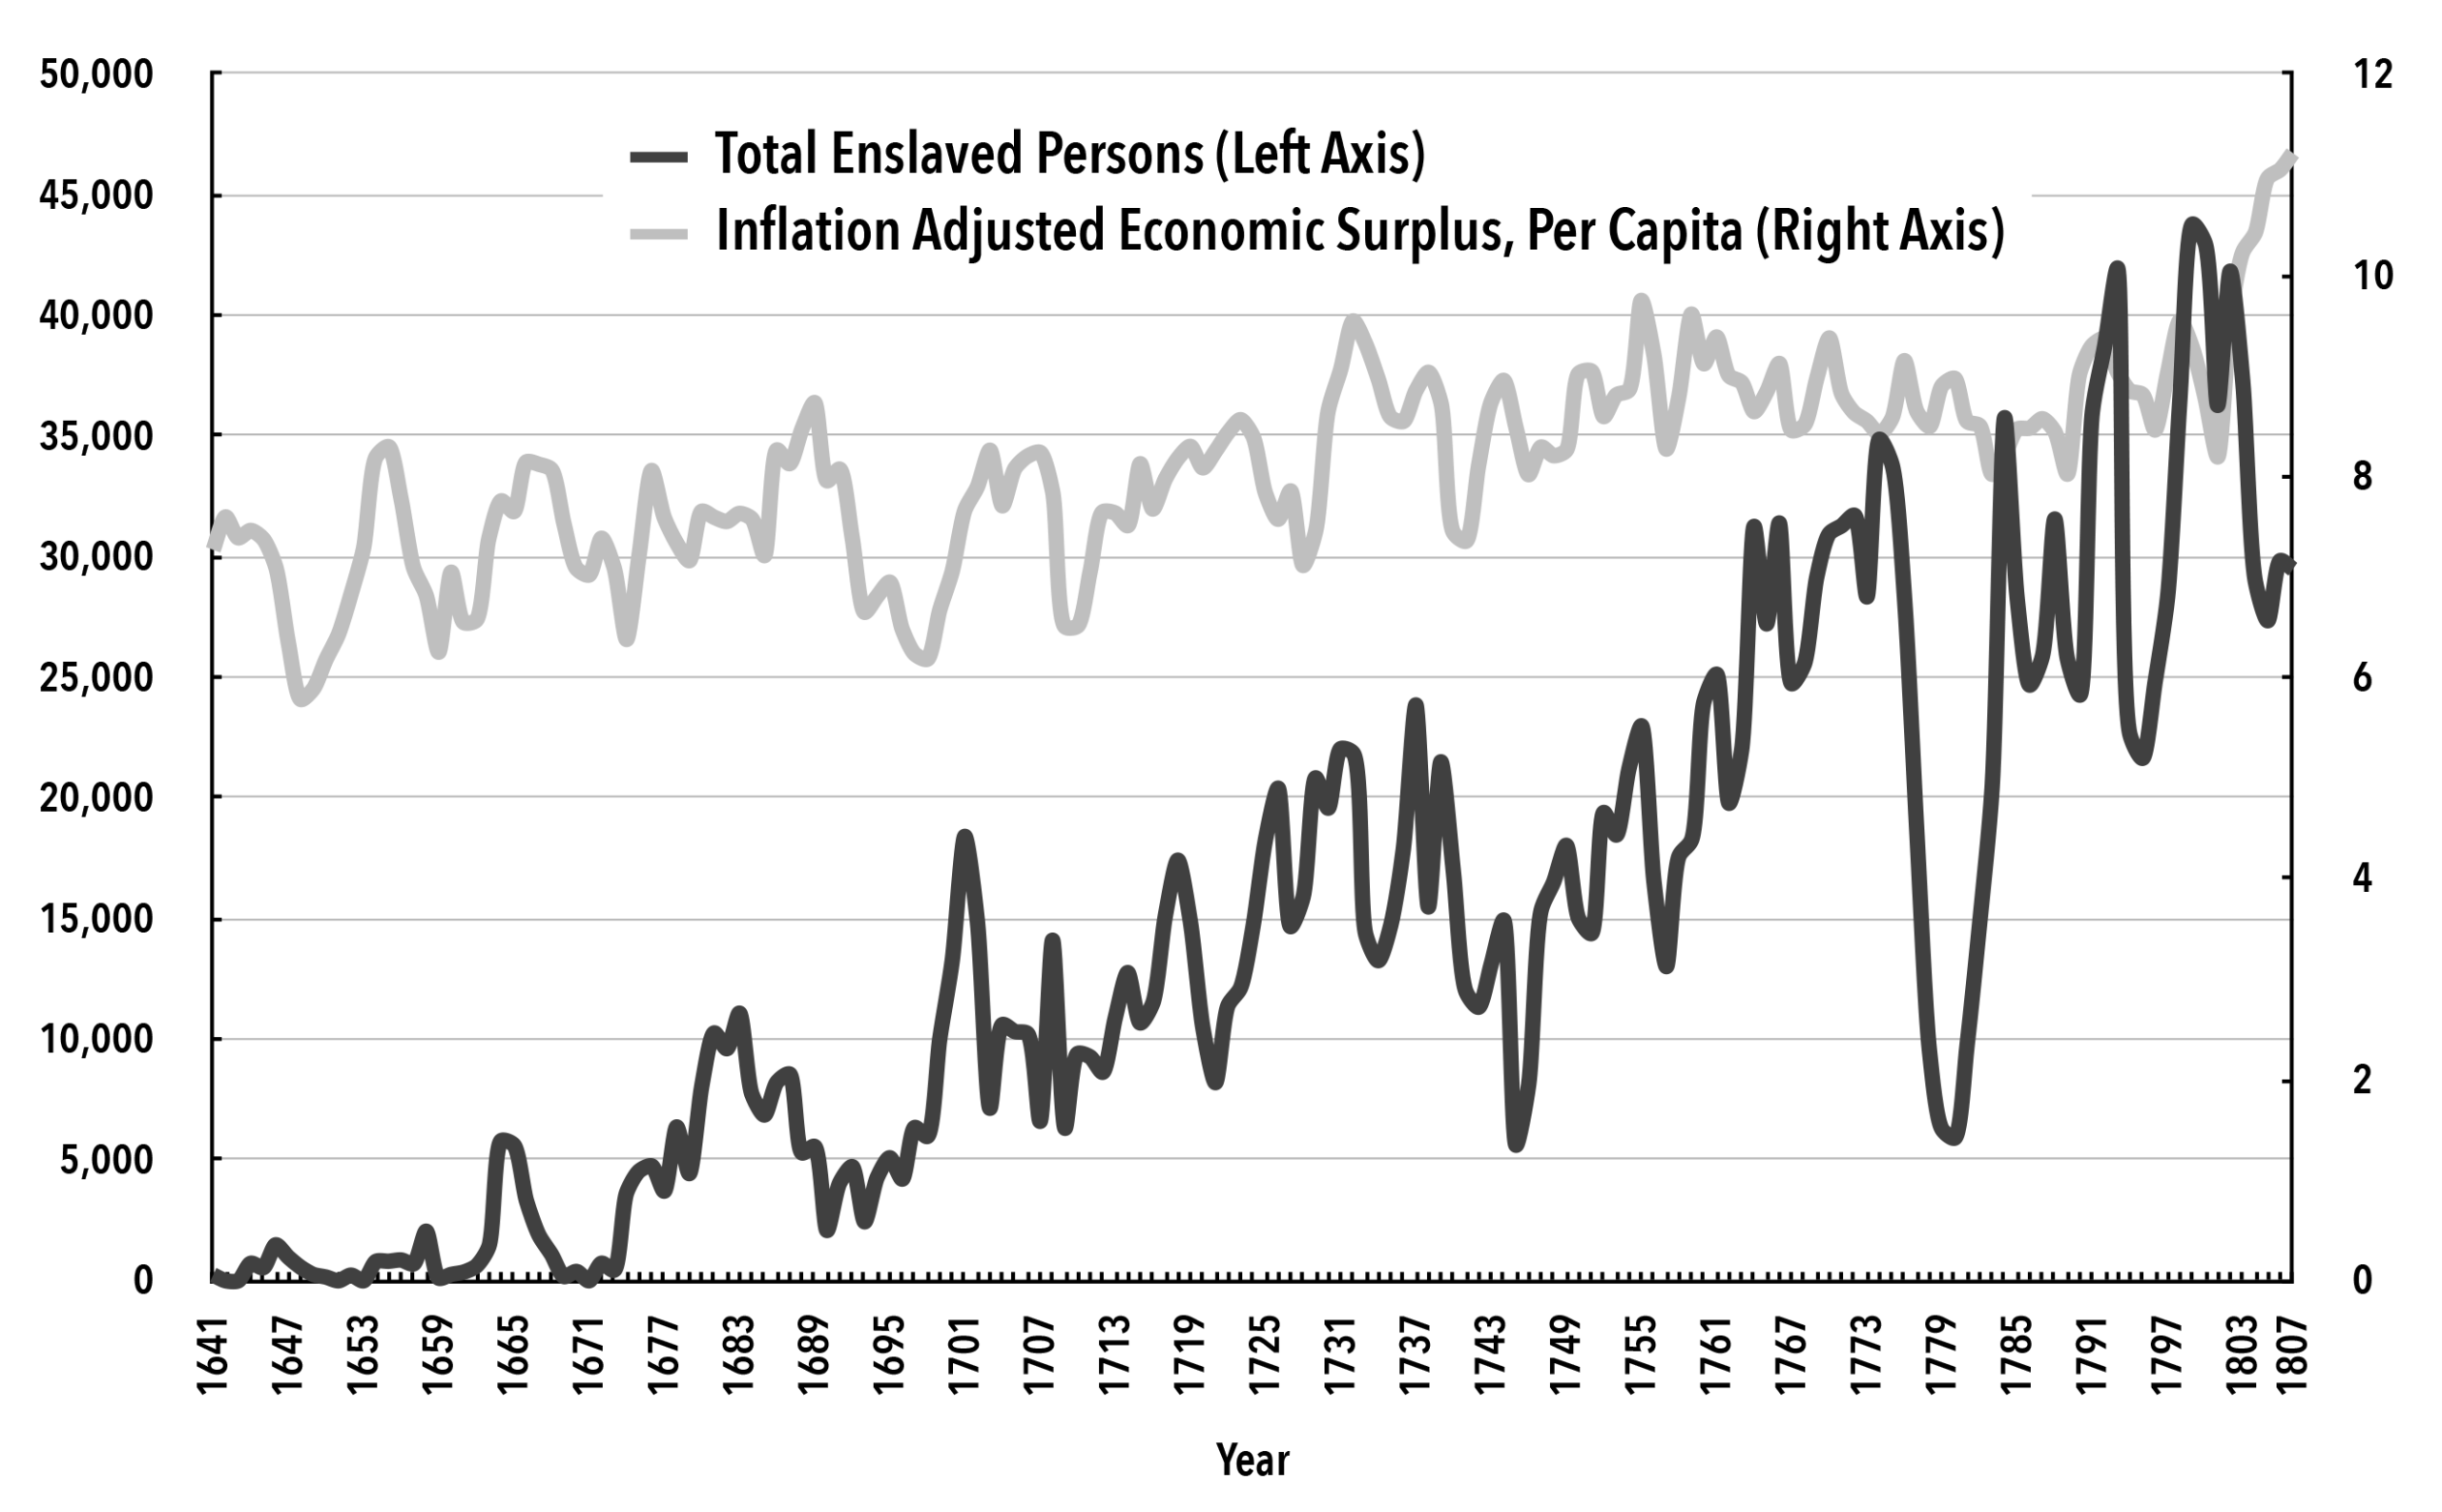
Sources and Notes: For data, see Chart 5. Economic surplus per capita has been adjusted for inflation.
Chart 7. Estimated Public Investment and Disembarked Enslaved Persons, 1641–1807
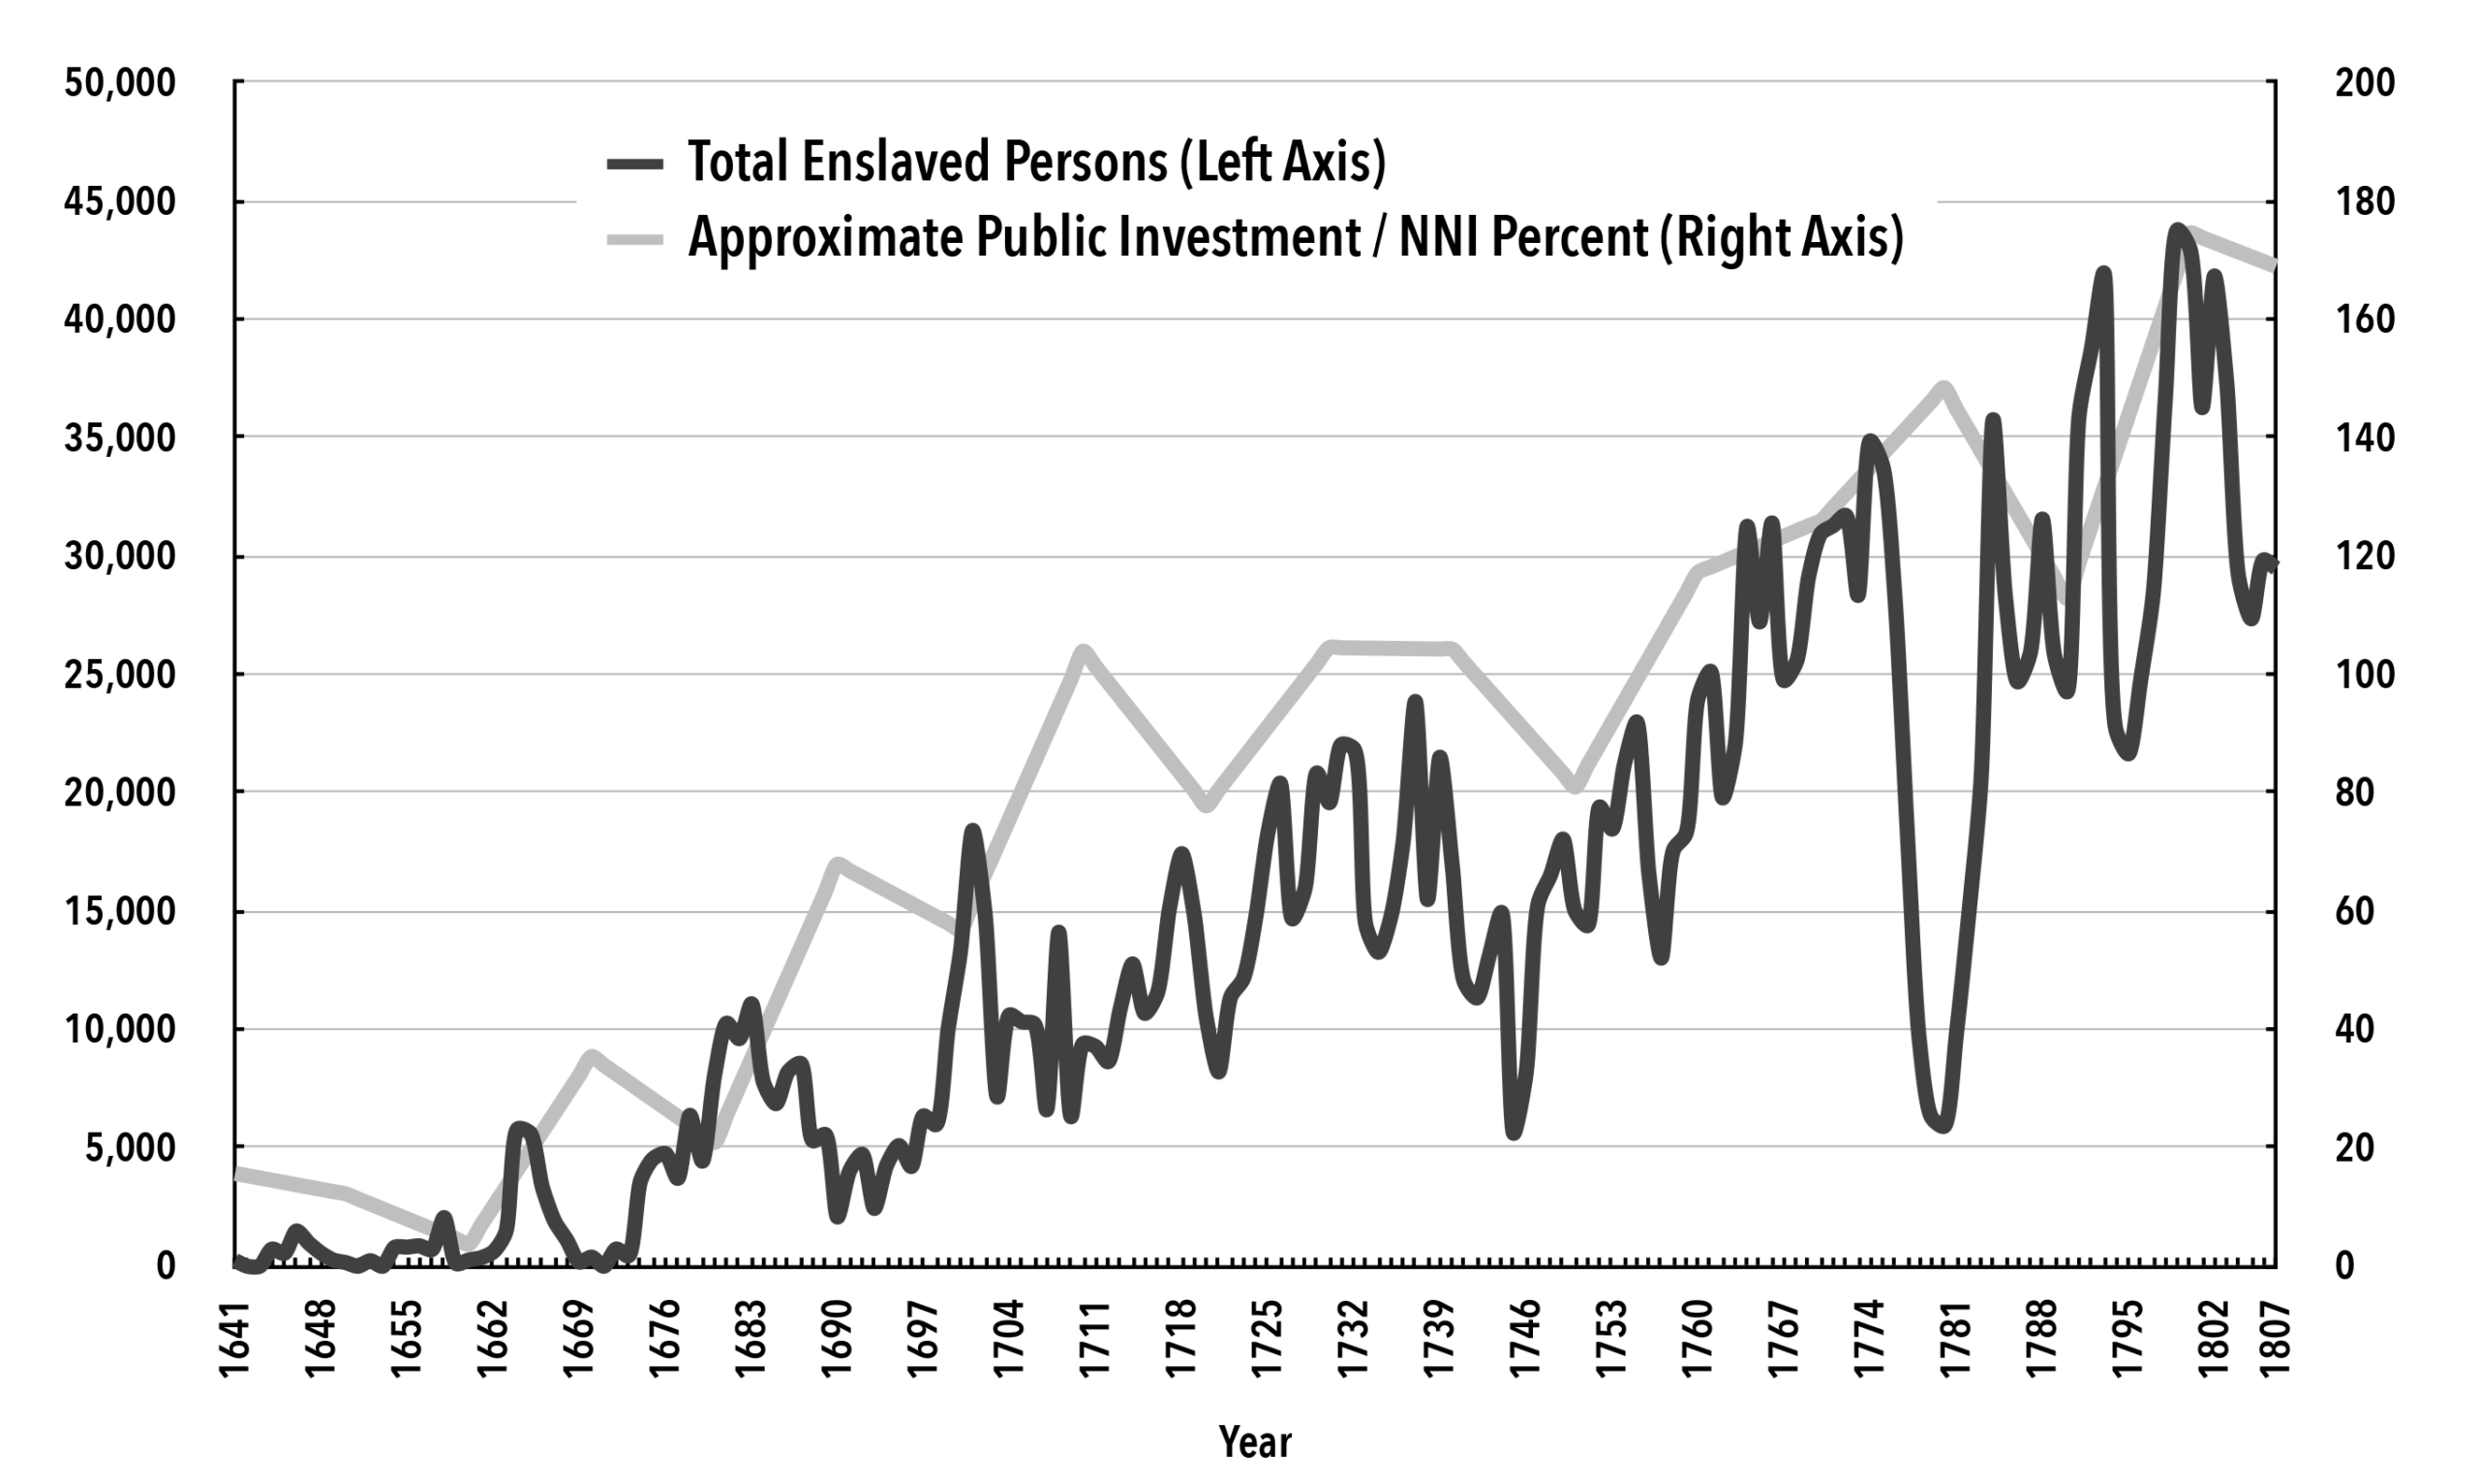
Sources and Notes: Data from Trans-Atlantic Slave Trade Database; Clark, “The Macroeconomic Aggregates for England, 1209–2008“; and Thomas E. Lambert, “British Public Investment, Government Spending, Housing, and the Industrial Revolution: A Study of Governmental and Social Surplus Absorption,” Journal of Economic Issues 58, no. 4 (December 2024): 1378–1401. Estimated public investment is expressed as a percentage of net national income per capita.
Chart 8. Real GDP Per Capita Index and Disembarked Enslaved Persons, 1563–1807
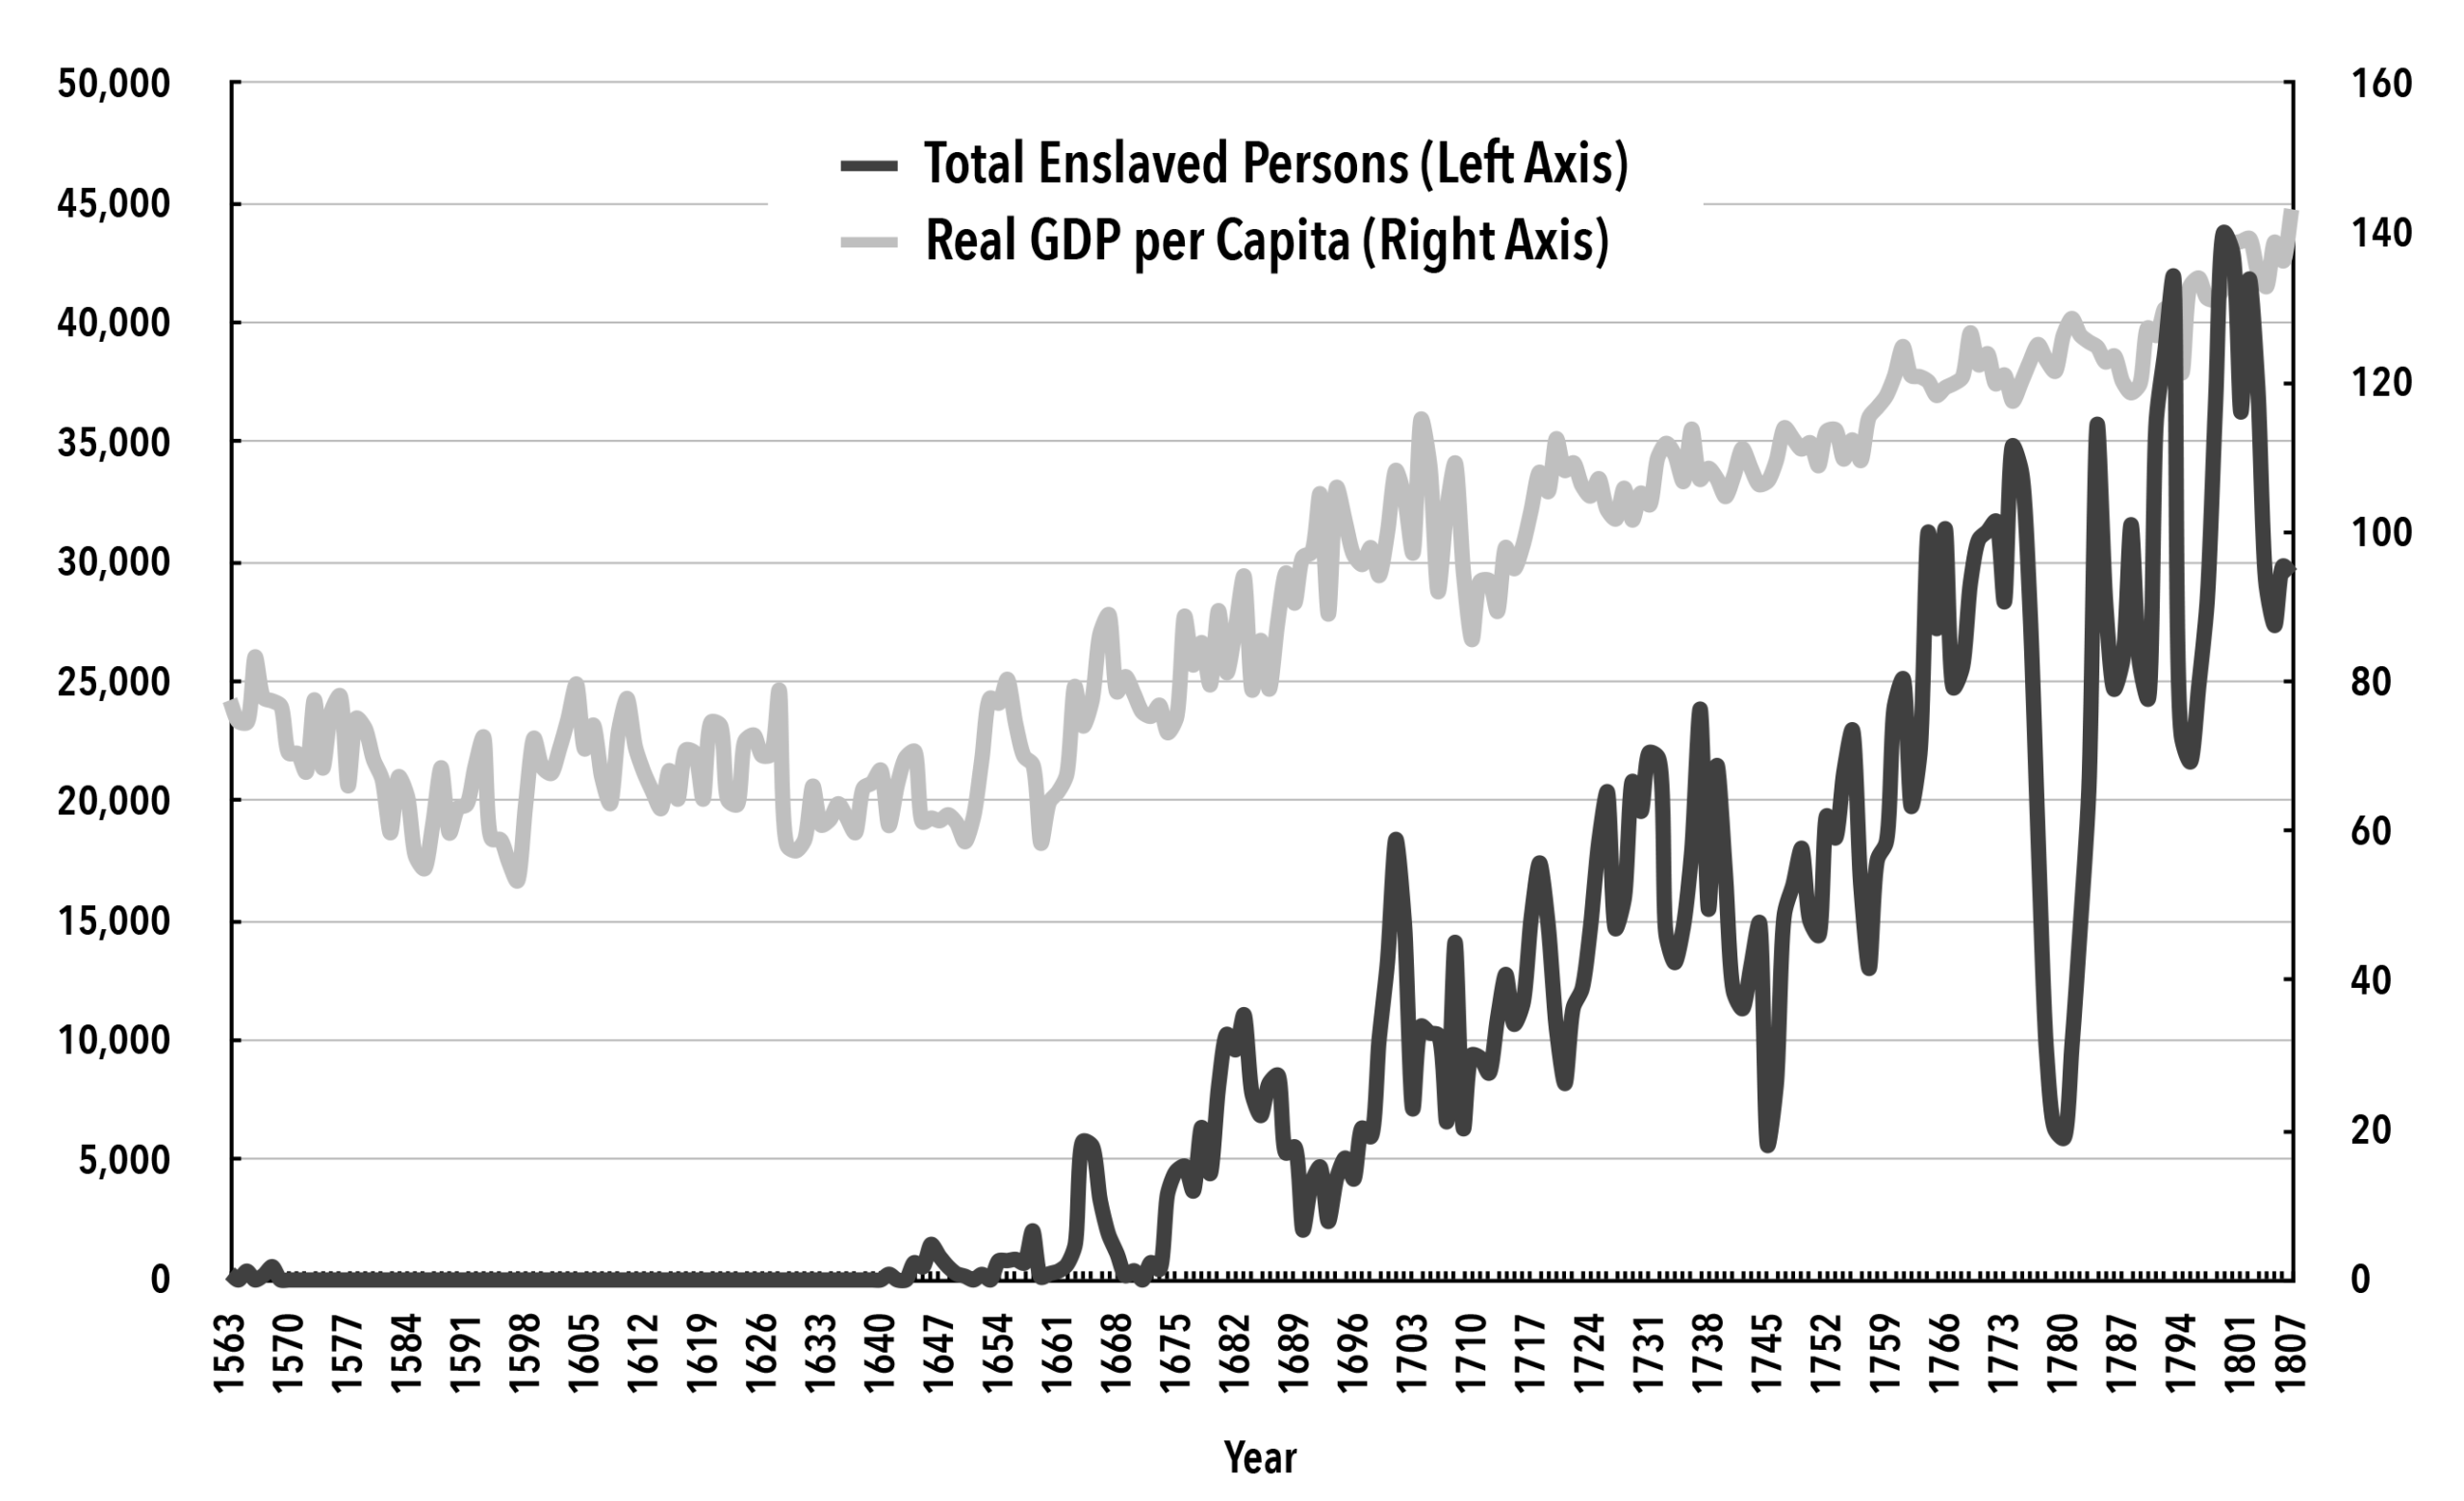
Sources: For data, see Chart 5.
What the Baran Ratio Reveals
Most important to the debate over the slave trade is how much money was earned by the slave trade and the plantations and how much of these earnings were sent back to Britain and reinvested in different industries so as to fuel the Industrial Revolution. Those who argue that the slave trade does not matter to the Industrial Revolution claim that the amounts of these earnings were small, whereas those who state that these are important argue that the amounts are large and significant.26 The Baran Ratio, which shows annually how much investment is made in an economy as a portion of economic surplus, is shown in Chart 9. The economic surplus shown in the chart is domestic UK economic surplus. For some years shown in the chart, the ratio is greater than one, which means that more than 100 percent of the domestic economic surplus is invested into the economy. To invest more than 100 percent of domestic economic surplus is impossible without other income sources or borrowing. Conventional economic theory contends that borrowing cannot adequately explain this, since taking on more private and public debt in order to boost investment would tend to cut into consumption.27 Instead, we find that consumption and net national income both trended upward during the eighteenth century for Britain according to the databases by Clark and by Broadberry and colleagues. Hence, this amount of investment requires capital inflows coming in from overseas trade and production, or, in some cases, expropriating assets from foreign colonies. Indeed, if Clark’s estimates of capital income on domestic capital items/assets and rates of return are accurate and my own estimates from previous publications are reasonable with respect to annual investment amounts, then Baran Ratios greater than 1.0 can mostly, if not entirely, be explained by profits or surplus coming from overseas to help investment rates exceed 100 percent of domestic economic surplus. Using values of exports and re-exports from the 1700s as a portion of domestic economic surplus illustrates this, something for which the working paper provides more detail. Most of the value of exports and re-exports come from commodities generated and mass produced by the enslaved. This suggests further and perhaps more emphatically the role that the slave trade plays in the Industrial Revolution. These estimates also underscore the argument or observation that the Industrial Revolution was fueled by what economists call “export-led growth,” a modern example of which is China’s growth over the last thirty to forty years. As can be seen in Chart 9, some of the largest Baran Ratios occur during the eighteenth century and during the time of the Industrial Revolution.28
Chart 9. Baran Ratio, 1640–1807
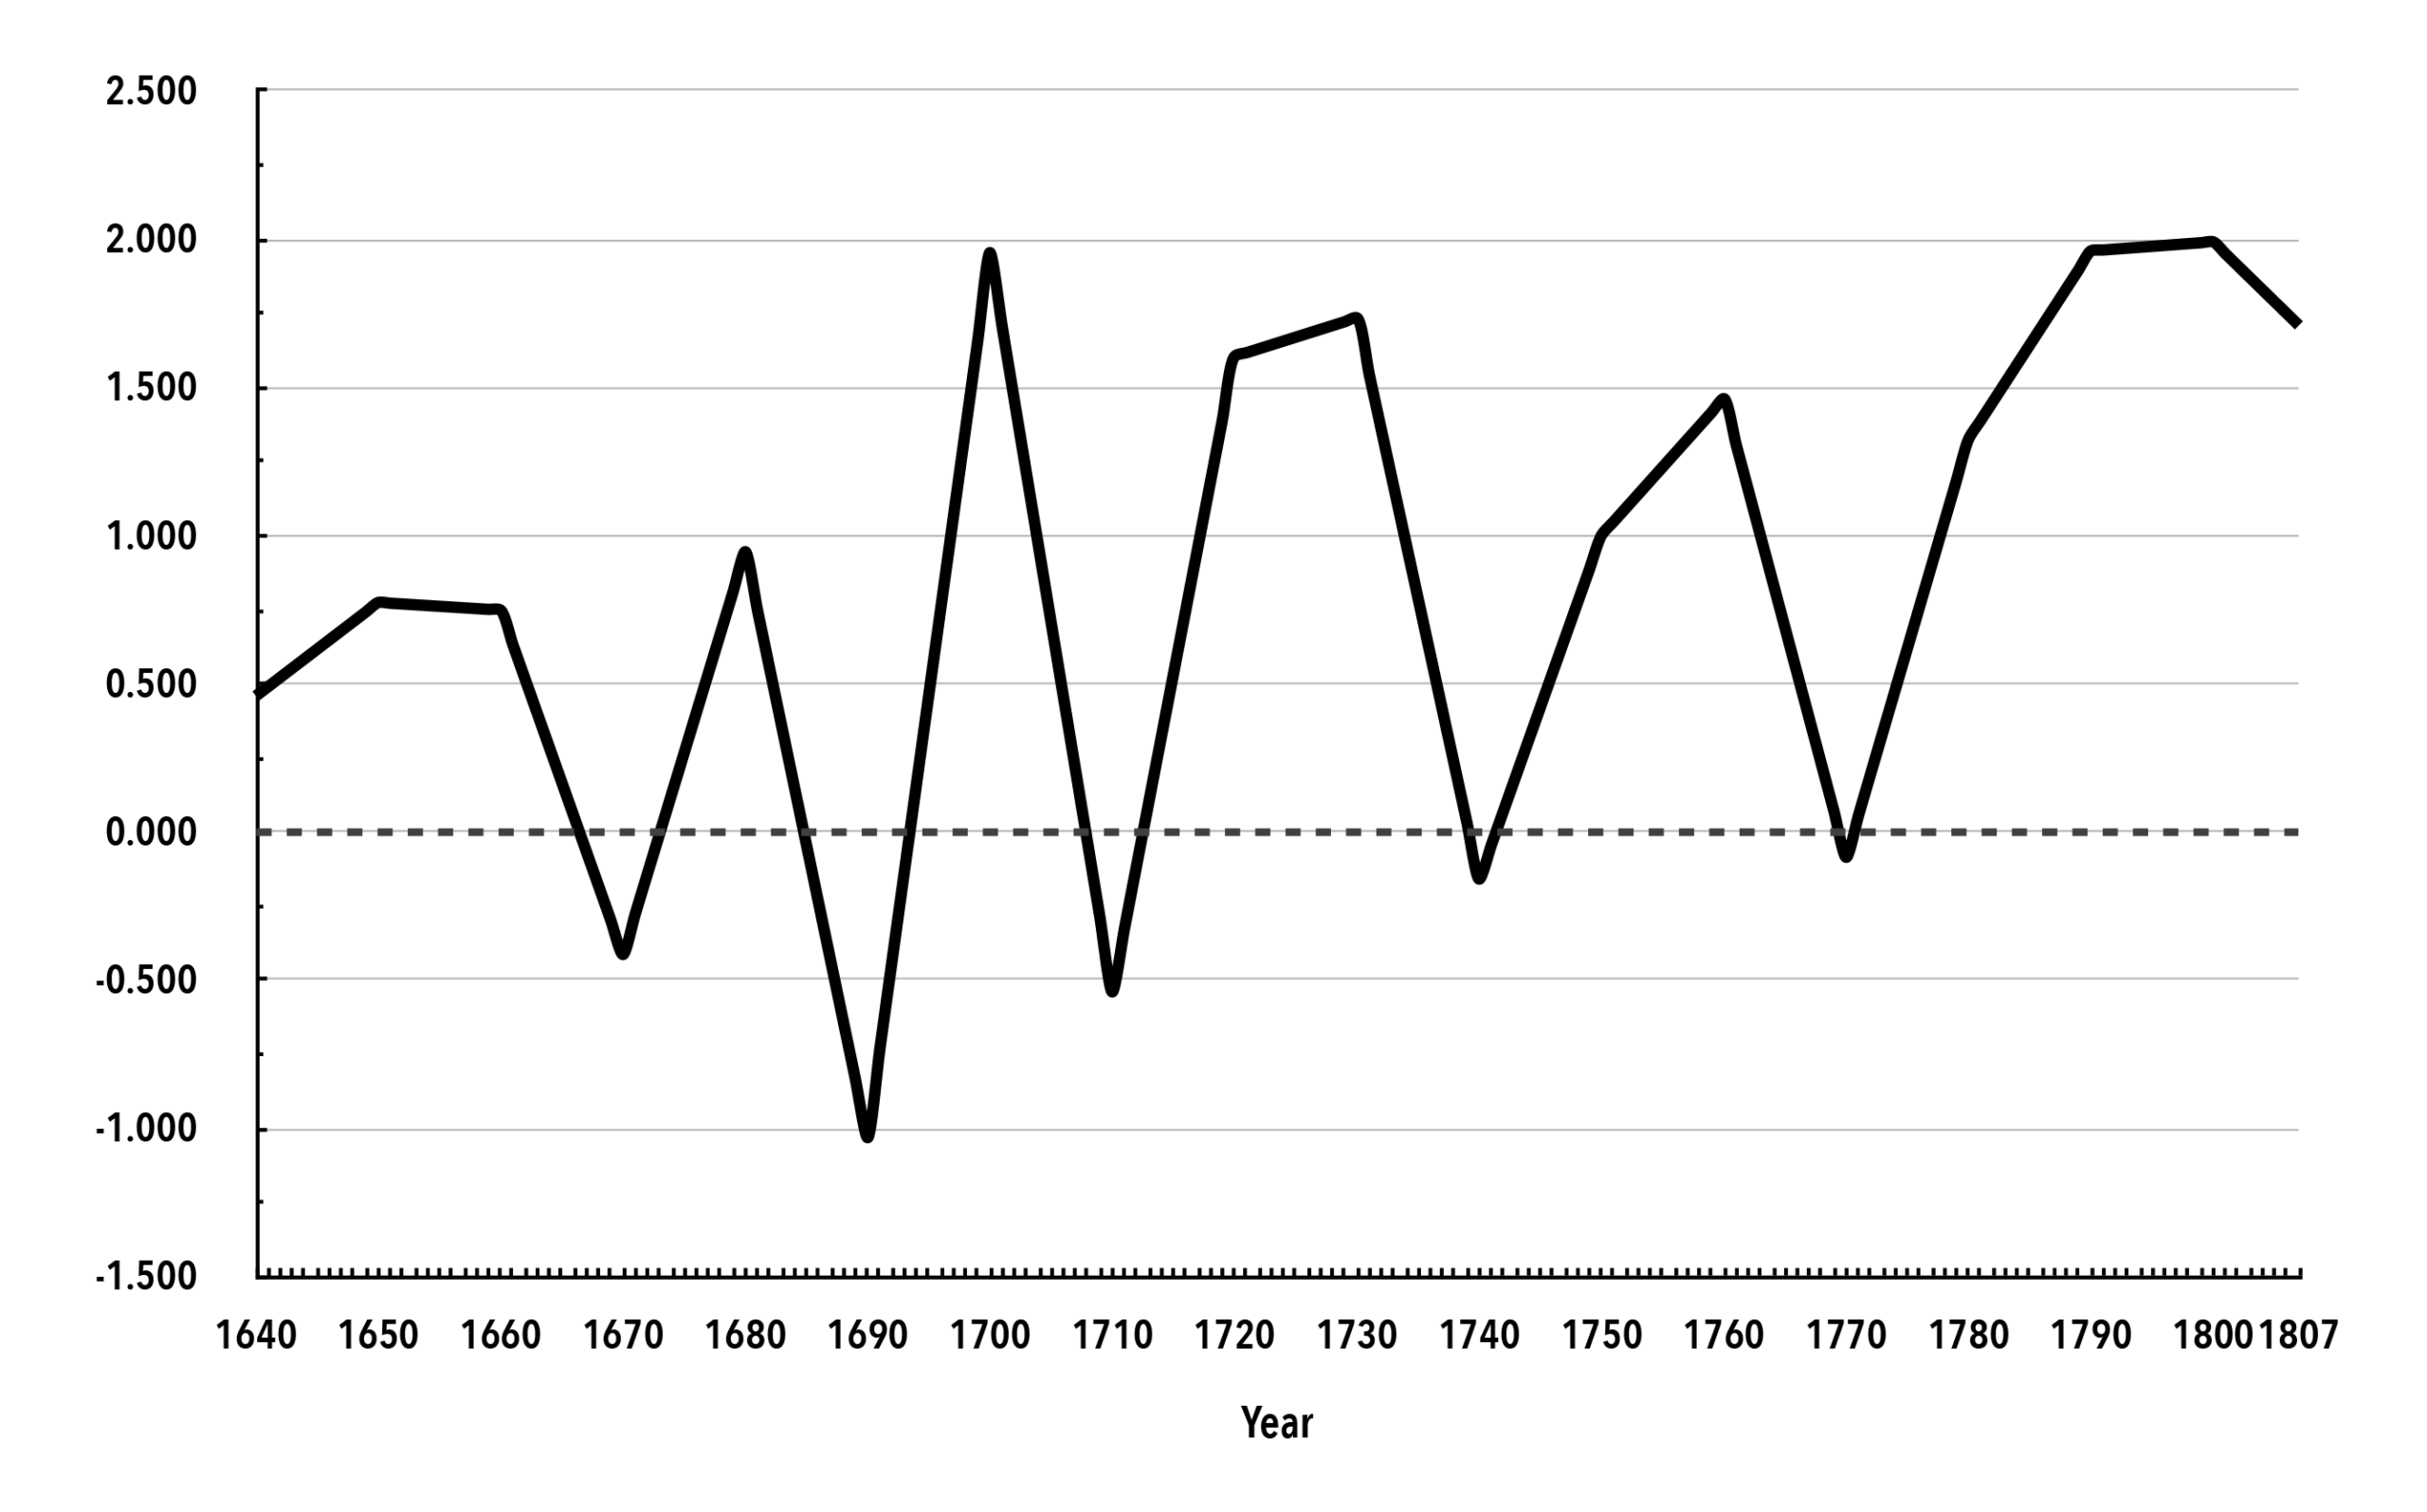
Sources and Notes: Based on author’s calculations.
Conclusion
Correlations between two variables, no matter how strong the correlation may be, do not mean that one variable causes or directly affects or impacts the other. One cannot infer causality from correlation. However, the results of the data exploration given in this article provide ample evidence that the slave trade can be considered a major factor in the British Industrial Revolution. As Berg and Hudson note, during the time of the slave trade, many leading British politicians and businessmen attributed Britain’s economic growth to being triggered by and supported by the slave trade, Smith’s comments on it notwithstanding. So why, then, does minimizing or not acknowledging the role that the slave trade played in British economic development and the Industrial Revolution still persist among some scholars?
As mentioned earlier, Smith’s writings are often regarded as sacrosanct among many economists, and so it is possible that many of them assume, despite evidence to the contrary, that the slave trade was a drag on Britain’s economy and could not have helped it. As during Williams’s time, if the main reasons given for the growth of Britain’s economy leading up to and including the Industrial Revolution list the importance of private property rights, the innovativeness and industriousness of entrepreneurs, the growth of free markets, and the limiting of government involvement in the economy, then these reasons for social and economic advancement sound more humane—almost heroic—when compared to a story that involves human bondage and slavery as a catalyst for development. Therefore, many have been taught that slavery contributed little toward economic progress, was a “money loser,” and hindered economic growth in the places where it took place despite evidence to the contrary by many historians.
Yet, to ignore or deny completely slavery’s impact as at least one major factor if not the major factor in the Industrial Revolution is tantamount to trying to rewrite history. Similar to the story of the Southern states’ rebellion during the U.S. Civil War as being a “noble cause” and being about “states’ rights” rather than about slavery, it appears that some are still in denial about a horrifying and inhuman part of the global history of capitalism, the effects of which persist to this day in Africa’s underdevelopment and structures of racial oppression and imperialism worldwide.29 In my home state of Kentucky, most Civil War Veterans’ memorials are for Confederate soldiers, even though during the war an overwhelming number of Kentuckians actually fought for the Union.30 Despite efforts to recast the past by using limited or skewed perspectives, the quest to portray history more accurately is a struggle that must continue. This is especially so with respect to the impact of the slave trade on economic history.
Notes
- ↩ Eric Williams, Capitalism and Slavery (Chapel Hill: University of North Carolina Press, 1994); Karl Marx and Frederick Engels, “The Genesis of the Industrial Capitalist” in Capital, vol. 1 (London: Penguin, 1990 [1976]); John Bellamy Foster, Hannah Holleman, and Brett Clark, “Marx and Slavery,” Monthly Review 72, no. 3 (July–August 2020): 96–117; Ralph Leonard, “The Enduring Importance of Eric Williams’ ‘Capitalism and Slavery,'” MR Online, March 14, 2020. Beside claiming that slavery is a major, if not the most important, factor in the Industrial Revolution, Williams is also criticized for writing that slavery was collapsing and would have become obsolete before it was ended by edict or war. The latter assertion is objectionable to abolitionists and those who claim that revolts by enslaved people helped to hasten the end of slavery, although Williams does mention and acknowledge the role of such rebellions.
- ↩ Maxine Berg and Pat Hudson, Slavery, Capitalism, and the Industrial Revolution (Cambridge: Polity Press, 2023), 39–52. For more recent scholarly works generally supporting Williams’s thesis, among others, see William Darity, “A Model of ‘Original Sin’: Rise of the West and Lag of the Rest,” American Economic Review 82, no. 2 (February 199): 162–67; Barbara L. Solow, ed., Slavery and the Rise of the Atlantic System (Cambridge: Cambridge University Press, 1991); and Joseph E. Inikori, Africans and the Industrial Revolution in England: A Study in International Trade and Economic Development (Cambridge: Cambridge University Press, 2002). For those opposed to Williams see, among others, Stanley L. Engerman, “The Slave Trade and British Capital Formation in the Eighteenth Century: A Comment on the Williams Thesis,” Business History Review 46, no. 4 (January 1972): 430–44; David Eltis and Stanley L. Engerman, “The Importance of Slavery and the Slave Trade to Industrializing Britain,” Journal of Economic History 60, no. 1 (March 2000): 123–44; and C. Knick Harley, “Slavery, the British Atlantic Economy, and the Industrial Revolution,” Oxford Economic and Social History Working Papers no. 113, University of Oxford, Department of Economics, 2013.
- ↩ Berg and Hudson, Slavery, Capitalism, and the Industrial Revolution, 39–52.
- ↩ Berg and Hudson, Slavery, Capitalism, and the Industrial Revolution, 41–42.
- ↩ Adam Smith, The Wealth of Nations (Oxford: Oxford University Press, 1993), book 1, chapter 8; book 3, chapter 2; and book 4, chapter 7.
- ↩ The references section of their book covers thirty-five pages.
- ↩ Lawrence Goldman, “Slavery, Capitalism and the Industrial Revolution: A Dissent,” History Reclaimed, December 9, 2023; Kristian Niemietz, Imperial Measurement: A Cost-Benefit Analysis of Western Colonialism (London: Institute of Economic Affairs, 2024), iea.org.uk.
- ↩ Stephan Heblich, Stephen J. Redding, and Henry Voth, “Slavery and the British Industrial Revolution,” NBER Working Paper 30451, 2022.
- ↩ This paper is an abridged and less technical version of one part of my working paper: Thomas E. Lambert, “Horses, Serfs, Slaves, and Transitions Debates,” 2024, a version of which can be found at the University of Louisville’s Think IR site, library.louisville.edu/faculty/975. See also Thomas E. Lambert, “Paul Baran’s Economic Surplus Concept, the Baran Ratio, and the Decline of Feudalism,” Monthly Review 72, no. 7 (December 2020): 34–49; and Thomas E. Lambert, “Richard III, the Tudor Myth, and the Transition from Feudalism to Capitalism,” Monthly Review 76, no. 5 (October 2024): 1–11.
- ↩ Gregory Clark, “The Macroeconomic Aggregates for England, 1209–2008,” Economics Working Paper 09-19, University of California, Davis, 2015); Stephen Broadberry et al., British Economic Growth, 1270–1870 (Cambridge: Cambridge University, 2015).
- ↩ U.S. Census Bureau, “Average Price Paid in the Thirteen Colonies for Slaves from Britain’s American Colonies and West Africa from 1638 to 1775,” Statista, July 30, 2015, statista.com.
- ↩ Trans-Atlantic Slave Trade Database, 2024, slavevoyages.org; Bryan R. Mitchell, British Historical Statistics (Cambridge: Cambridge Books, Cambridge University, 2011 [1988]).
- ↩ These charts and data can also be found in Lambert, “Paul Baran’s Economic Surplus Concept, the Baran Ratio, and the Decline of Feudalism”; Thomas E. Lambert, “The Baran Ratio, Investment, and British Economic Growth and Development,” Journal of Post Keynesian Economics 46, no. 1 (2023): 142–72; Thomas E. Lambert, “Conjectures of British Investment, Tax Revenues, and Deficit Amounts from the Thirteenth to the Nineteenth Century Using the Concept of Economic Surplus,” Journal of Economic Issues 58, no. 1 (March 2024): 327–44; Thomas E. Lambert, “British Public Investment, Government Spending, Housing, and the Industrial Revolution,” Journal of Economic Issues, 58, no. 4 (December 2024): 1378-1401. See also Lambert, “Horses, Serfs, Slaves, and Transitions Debates.”
- ↩ See UK Parliament, “Parliament Abolishes the Slave Trade,” n.d., parliament.uk. Another reason why so many zero values appear is likely because during the beginnings of the colonial conquest of the Americas, Indigenous peoples and enslaved or indentured whites were used as laborers. However, this system was fraught with problems and essentially collapsed. Williams chronicles all of this in the first chapter of his book. Unfortunately, there really is no dataset giving estimates of Indigenous or whites in enslavement or servitude that can be found, and it is in the middle of the seventeenth century when the trade in enslaved Black people begins to accelerate.
- ↩ Lambert, “Horses, Serfs, Slaves, and Transitions Debates.” Many of the graphs and statistical work in this working paper use all of the Slave Trade Database data, from 1563 to 1807 or 1809, for full analysis, although analyses from 1641 to 1807 often result in a better statistical fit between each variable in a pair of variables.
- ↩ Paul A. Baran, “Economic Progress and Economic Surplus,” Science & Society 17, no. 4 (1953): 289–317; Paul A. Baran, The Political Economy of Growth (New York: Monthly Review Press, 1957); and Paul A. Baran and Paul M. Sweezy, Monopoly Capital (New York: Monthly Review Press, 1966). Baran and Sweezy include as part of the economic surplus spending not just profits, rents, net interest, and taxes, but also wasteful business and governmental expenditures on advertising, marketing, and military spending. Unfortunately, the databases that I use here do not detail such wasteful spending, except perhaps for military expenditures. For the purposes of this article, I show how as business profits, capital income (which includes interest), and rents as well as tax revenues go up, how much was reinvested in the British economy, and how this coincides with the growth of the slave trade and related industries.
- ↩ In his database, Clark includes interest as part of capital income, treated here as gross profits.
- ↩ Zhun Xu, “Economic Surplus, the Baran Ratio, and Capital Accumulation,” Monthly Review 70, no. 10 (March 2019): 25–39; Lambert, “Paul Baran’s Economic Surplus Concept, the Baran Ratio, and the Decline of Feudalism”; Lambert, “Conjectures of British Investment, Tax Revenues, and Deficit Amounts from the Thirteenth to the Nineteenth Century using the Concept of Economic Surplus”; Lambert, “British Public Investment, Government Spending, Housing, and the Industrial Revolution: A Study of Governmental and Social Surplus Absorption”; see also Lambert, “Richard III, the Tudor Myth, and the Transition from Feudalism to Capitalism.”
- ↩ In the earlier version of the working paper, coffee was stated as not being correlated with the slave trade. However, in analyzing the data further, there is some type of connection that is statistically significant and not spurious. The fit is around 40 percent. This has been updated in the most recent version of my working paper, “Horses, Serfs, Slaves, and Transitions Debates.” Supposedly, sugar and some other forms of agricultural production were more labor intensive than tobacco and coffee. Inflation-adjusted tobacco imports do show a mild connection (20 percent fit) with the slave trade if one uses enslaved people who were disembarked in mainland North America as a subset of all enslaved individuals disembarked from British ships. Interestingly, this does not hold up if the enslaved people disembarking only in the colonies/states of Maryland, Virginia, and North Carolina are matched with tobacco values. One problem in using more specific regional data from the Slave Voyages database is that some regions are missing. For instance, in trying to pinpoint cotton production, the French, then Spanish, and again French colony Louisiana is missing; yet it was an area for cotton production.
- ↩ For more on intensity of enslaved labor and cultivation of different goods, see Klas Rönnbäck, “Sugar Plantation Slavery,” Oxford Research Encyclopedia of African History, January 31, 2023; Barbara L. Solow, “Capitalism and Slavery in the Exceedingly Long Run,” Journal of Interdisciplinary History 17, no. 4 (Spring 1987): 711–37; Understanding Slavery Initiative, “Plantation Conditions,” understandingslavery.com; Lowcountry Digital History Initiative, “Regional Labor Experiences: Sugar and Tobacco,” ldhi.library.cofc.edu.
- ↩ Stephen D. Behrendt, “Seasonality in the Trans-Atlantic Slave Trade,” March 14, 2024 (originally published 2008), saylor.org.
- ↩ The earlier posted draft of the working paper mentioned that slaves and the food processing index are not co-integrated, but this is because the data examined there go from 1563 to 1807. What is displayed here, which spans 1641 to 1807, may be a better method of examining the data. The trends displayed in the chart are co-integrated. The relationship between the metal and mining index is not co-integrated until both variables are put into a natural log form, which is a way of correcting for non-stationarity. In the most recent draft of the working paper, it is shown that the slave trade is correlated and co-integrated with tin and iron production in Britain going back to 1563. All this was updated in the last version posted of Lambert, “Horses, Serfs, Slaves, and Transitions Debates.”
- ↩ The working paper allows that the data between slaves and coal output are not co-integrated from 1563 to 1807, but their log forms are from 1641 to 1807, with a 90 percent confidence interval.
- ↩ Lambert, “British Public Investment, Government Spending, Housing, and the Industrial Revolution.”
- ↩ See also Fred Lewsey, “‘Nation of Makers’: Britain Industrialised over a Century Earlier than History Books Claim,” Cambridge University, April 5, 2024, which demonstrates similar patterns.
- ↩ Barbara Solow claims that the amount of profits made on investment or return on investment in the new world could be as much as five times higher than those in Britain during the time of the slave trade, and asserts that the amount of investment due to slave trade and plantation profits had to affect British economic growth greatly. See Barbara L. Solow, The Economic Consequences of the Atlantic Slave Trade (Lanham: Lexington Books, 2014), 91–93.
- ↩ Heterodox economists, while disagreeing with the economic constraint on borrowing in purely theoretical terms, would come to similar historical conclusions on the limits of debt-financed development in the nineteenth century context of capital scarcity and lack of idle capacity.
- ↩ The larger working paper goes into more detail on this argument and evidence. The value of exports and re-exports from Britain as a portion of British domestic capital income from 1697 to the early 1800s ranges from 50 to over 100 percent, which means that surplus from exports for domestic investment can make up a significant portion of domestic investment. The Baran Ratio also sometimes exceeds 1.0 or 100 percent in previous centuries. During the English takeover of Ireland in the reign of the Tudors, it sometimes went above 1.0, as Ireland basically became a colony. During this time period, the Tudors also grabbed Catholic Church property and wealth. It is not until the middle of the seventeenth century, with the slave trade taking off, that one sees more ratios above 1.0.
- ↩ Steve Cushion, Slavery in the British Empire and Its Legacy in the Modern World (New York: Monthly Review Press, 2025).
- ↩ A. C. Quisenberry, “Kentucky Union Troops in the Civil War,” Register of Kentucky State Historical Society 18, no. 54 (1920): 13–18.
s. e. anderson
author of The Black Holocaust for Beginners
"If WORK was good for you, the rich would leave none for the poor." (Haiti)
--------------------------------------------