Doubt about the program
53 views
Skip to first unread message

thenewb...@gmail.com
Feb 27, 2019, 8:22:17 AM2/27/19
to Biodiverse Users
Hi,
Nowadays im learning how to use Biodiverse and I find Biodiverse a very useful tool, but i have some questions about the program.
I wonder if the program is able to filter the data that you charge on Basedata, I mean if Biodiverse is able to do something similar to Excel. For example, I have 10 species and 5 are from Rome and 5 are from Milan, my question is if i can select only the 5 from Rome and do some analysis with them.
Another question is if Biodiverse is able to distinguish one specie which has diferente properties. I ask about this because in my CSV file there are several individual that belong to the same specie but some individual have difereten values on the same propertie and I can only see that the program identify how many individual of the specie are in my data but it doesn´t diference between them.
I hope to have explained myself weel and i´m looking forwar to your answer.
Thank you very much.

Shawn Laffan
Feb 27, 2019, 8:19:12 PM2/27/19
to biodiver...@googlegroups.com
Thanks for the questions.
One overall point is that, once the observations have been aggregated into groups, they cannot normally be disaggregated to recreate the original data. This means that the answers somewhat depend on how aggregated your data are.
For the first case, the solution is to separate the subsets into new basedatas. If Rome and Milan are separate groups (or sets of groups) then you can use the Run Exclusions dialogue from the basedata menu, using a definition query to segregate the Milan from Rome groups.
Also, labels and groups can be deleted from a basedata, but only if it has no outputs. You can clone the basedata to create a new copy, and this can be used for the exclusions.
I have listed some examples as a new blog post at https://biodiverse-analysis-software.blogspot.com/2019/02/using-run-exclusions-dialogue.html
In the second case, you can load the property values as additional label axes when you import the data. In this way each species/property combination will be a unique label which can then be analysed. Note that measures such as richness will then be for the species/property combinations as they work on the unique labels, not the species per se. There are workarounds but they depend on your specific use cases.
Hopefully this helps, but please post more questions if you need more details.
Shawn.
--
You received this message because you are subscribed to the Google Groups "Biodiverse Users" group.
To unsubscribe from this group and stop receiving emails from it, send an email to biodiverse-use...@googlegroups.com.
To post to this group, send email to biodiver...@googlegroups.com.
To view this discussion on the web visit https://groups.google.com/d/msgid/biodiverse-users/a15043e8-8ea5-4523-a310-fce391f6a2f2%40googlegroups.com.
For more options, visit https://groups.google.com/d/optout.
thenewb...@gmail.com
Feb 28, 2019, 6:58:07 AM2/28/19
to Biodiverse Users
Hi!
Thank you very much for the answers, they have helped me, but i still have some doubts so I´m going to try to explain myself properly.
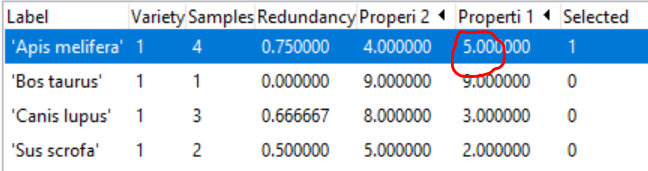
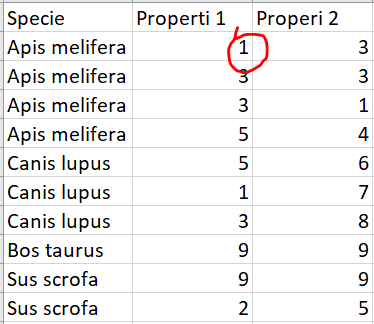
As you can see in the first image i have a CSV file with ocurrences (that own to some species) that also have some properties ( so i have individuals with properties and that individuals could own to the same specie), but in my basedata I only can see the name of the specie with one property of of one of the individuals who belong to that specie (like we can see in the second image).
For example imagine that I want to do Phylogenetic Analyses only of the ocurrences that has ¨1¨ in the Property 1. My problem is that the program only represent the name of the specie and the last property that is my CSV so for example i think that it means that there aren´t Apis melifera who has ¨1 in Property 1 so it wouldn´t be incorporated to my analyses and that would bring me fake results.
It´s a simple question but i know that its dificult to understand because it is hard to explain. I try it again with a resume.
In resume, once you have seen the images i think it´s easier to understand. So what i want to know is if it´s posible to see on the Basedata my four ocurrences of Apis melifera each one with their property, because what it shows me in this case is one Apis melifera ( that references the 4 cases) but only one property, that one which is the last on my CSV.
And then, if it is posible, I wonder how can I do the filter to do some analyses with for example those ocurrences whichs has 1 on property 1 ( including other ocurrences that belong to other specie)
I´m so sorry but I would like to use this program very well and that is the reason why I write so much. I hope my question is clear and hope it has possible answer.
Thank you very much again.
Shawn Laffan
Feb 28, 2019, 6:26:18 PM2/28/19
to biodiver...@googlegroups.com
Hello,
There are two options here.
(1)
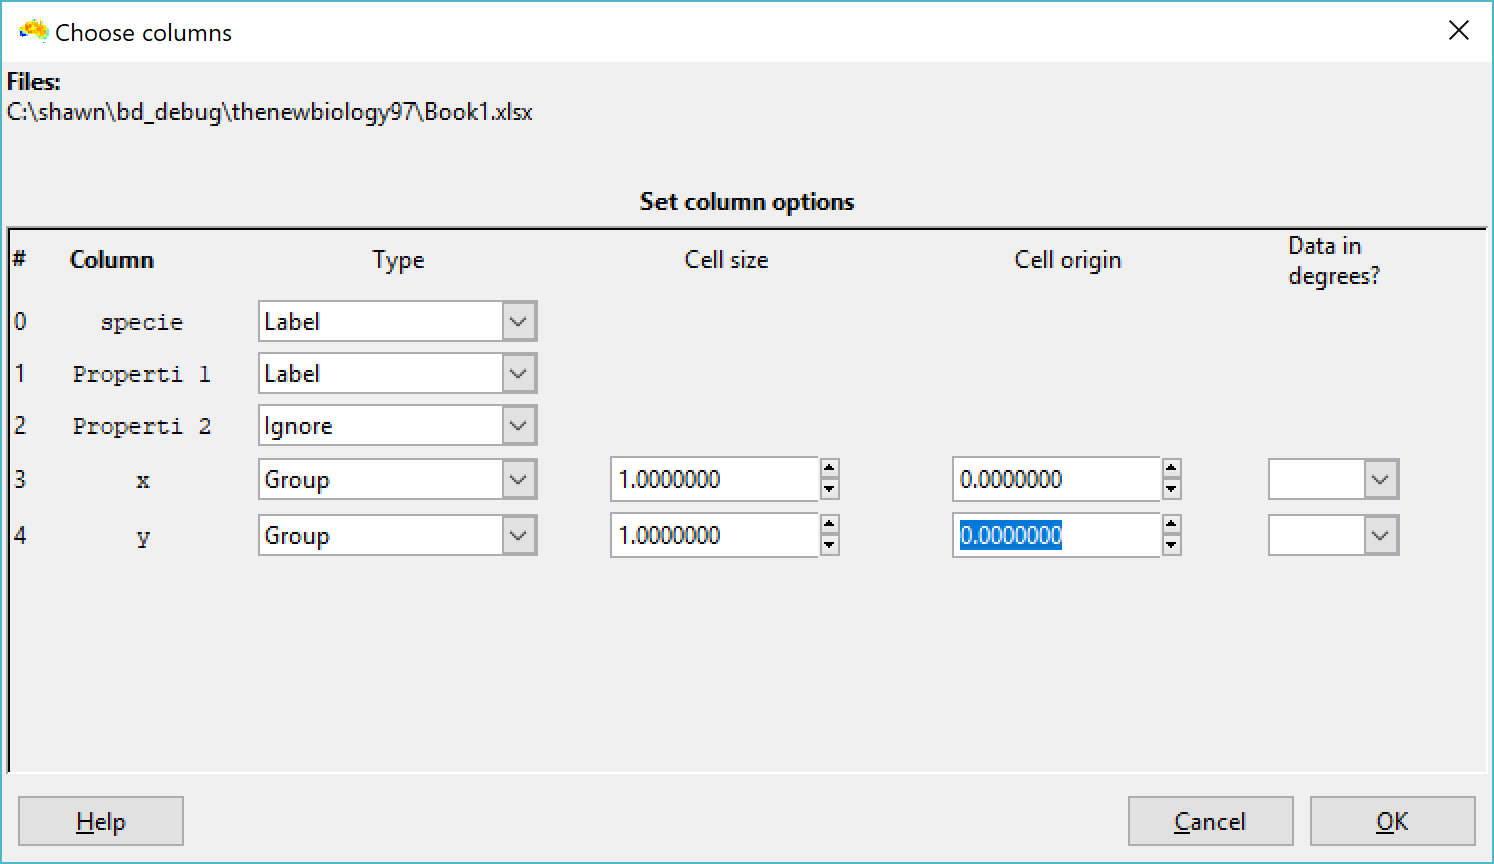
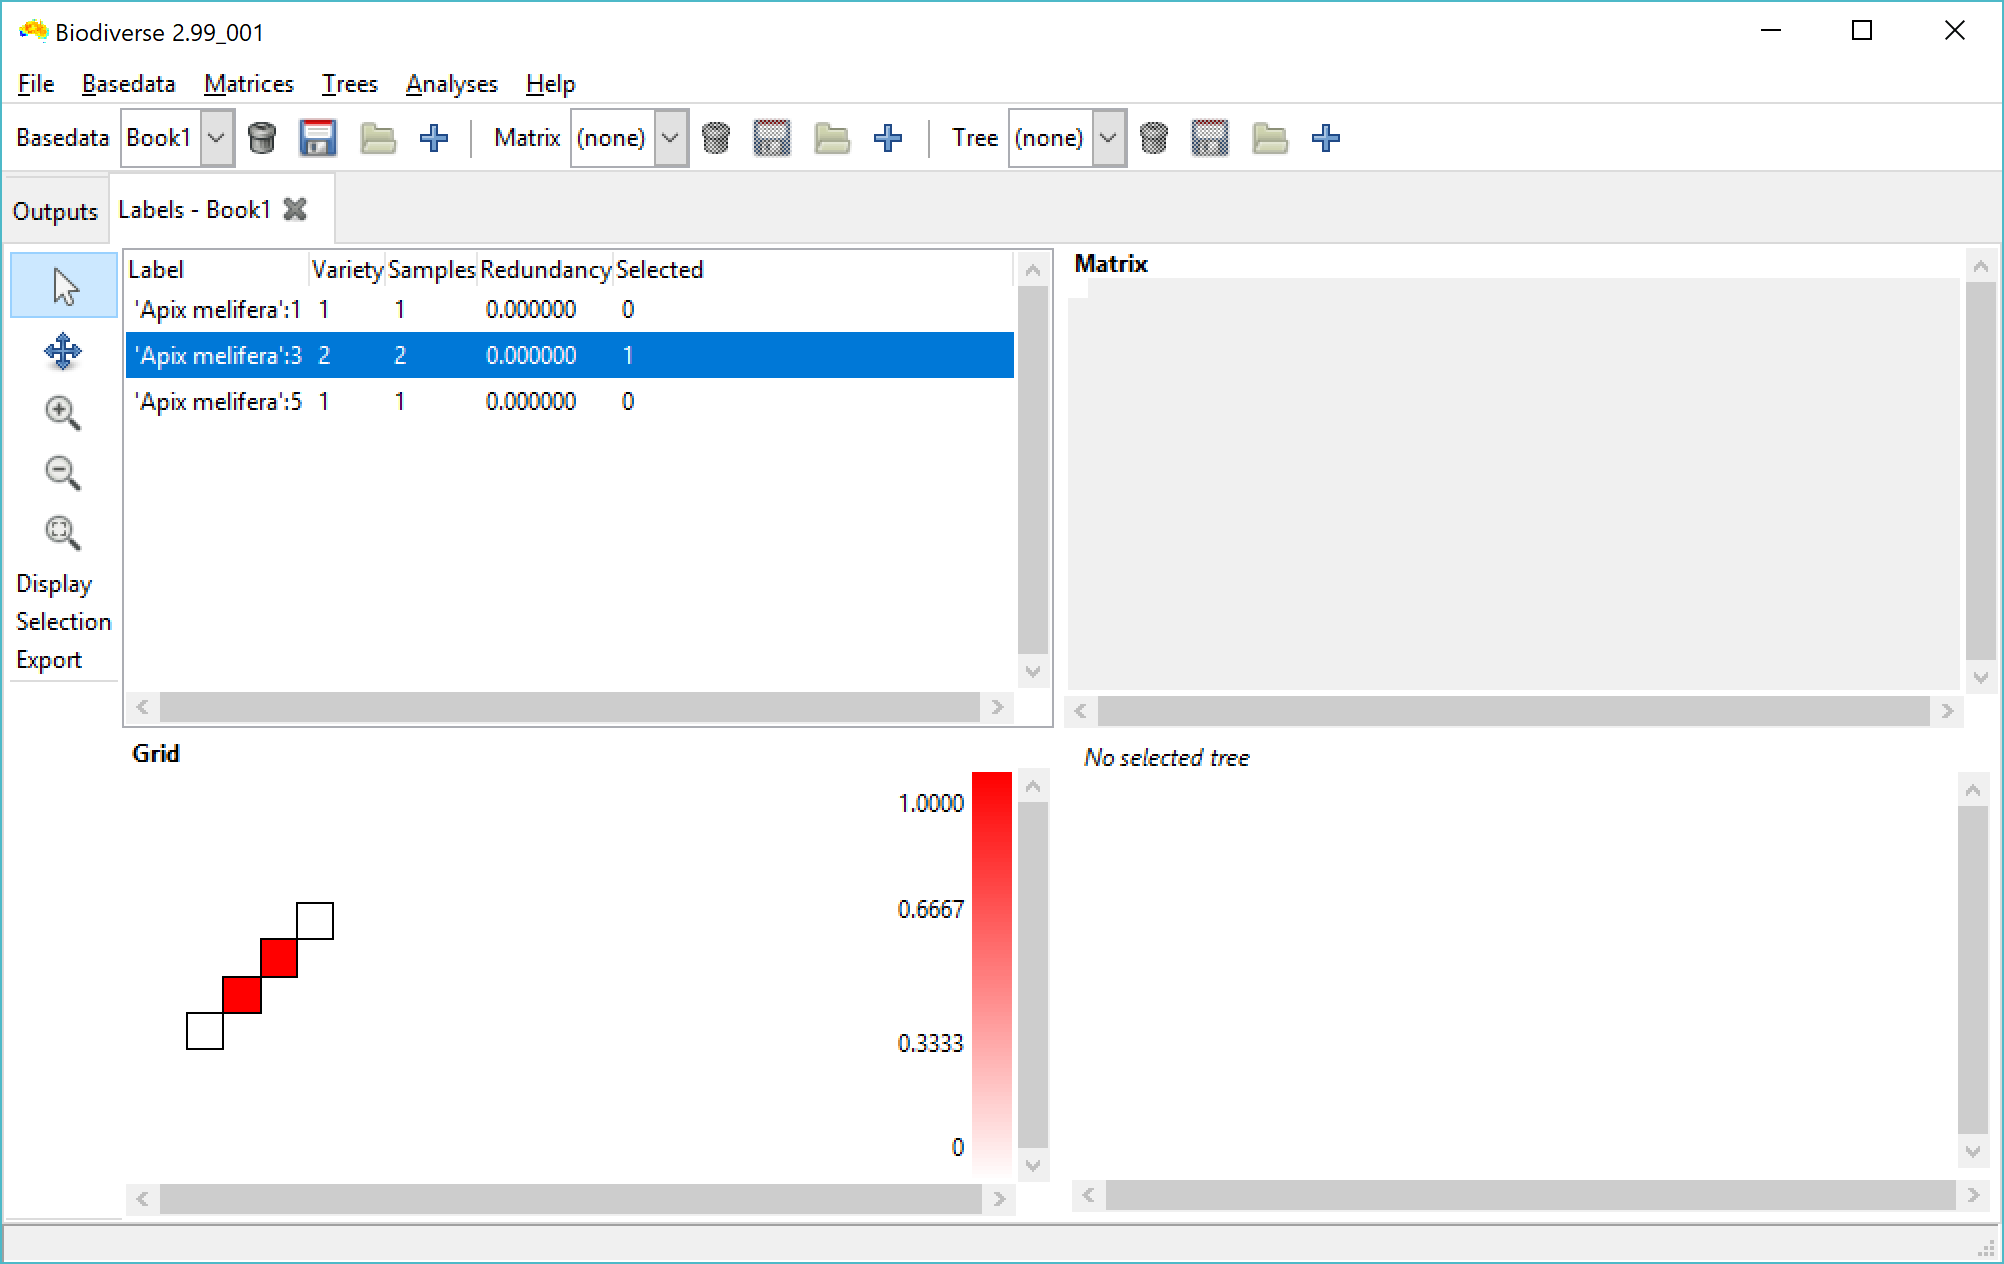
The first approach is something of a workaround, and is to use the property values as a label axis when you import your data. The first two screenshots below are an example of what happens, using a data set of only the Apis mellifera samples from your screenshot
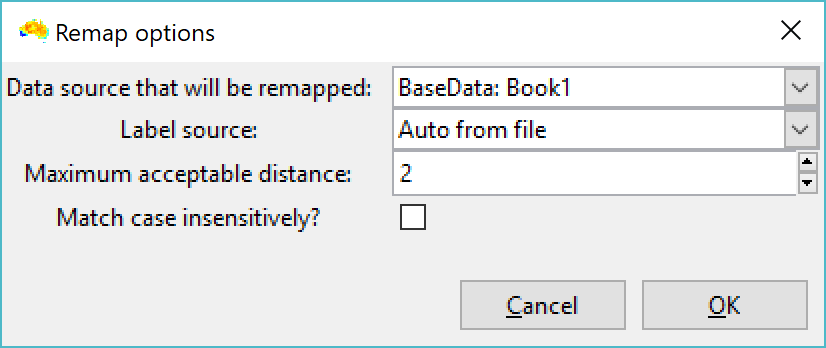
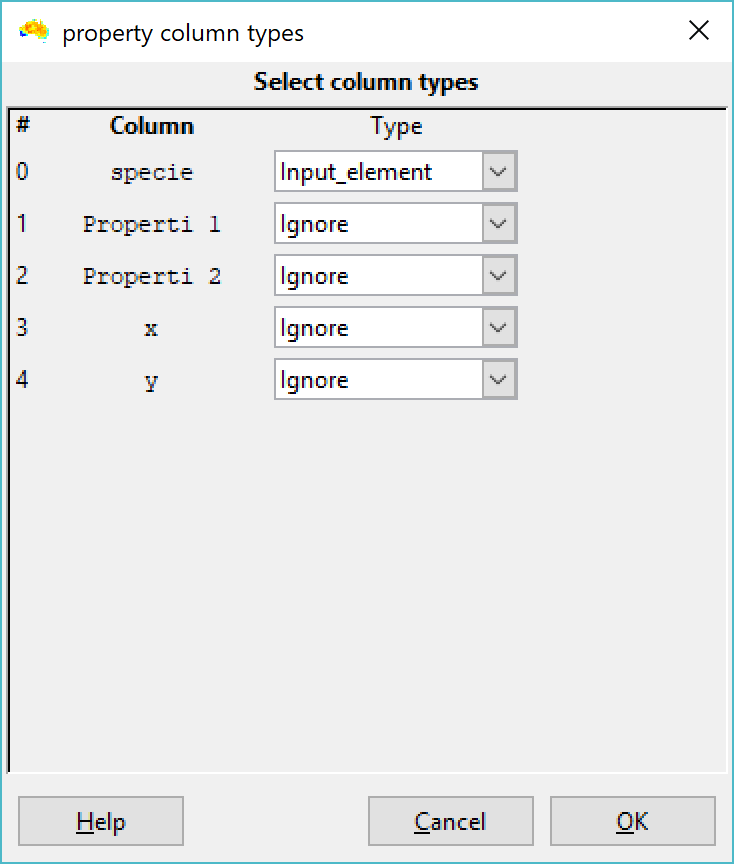
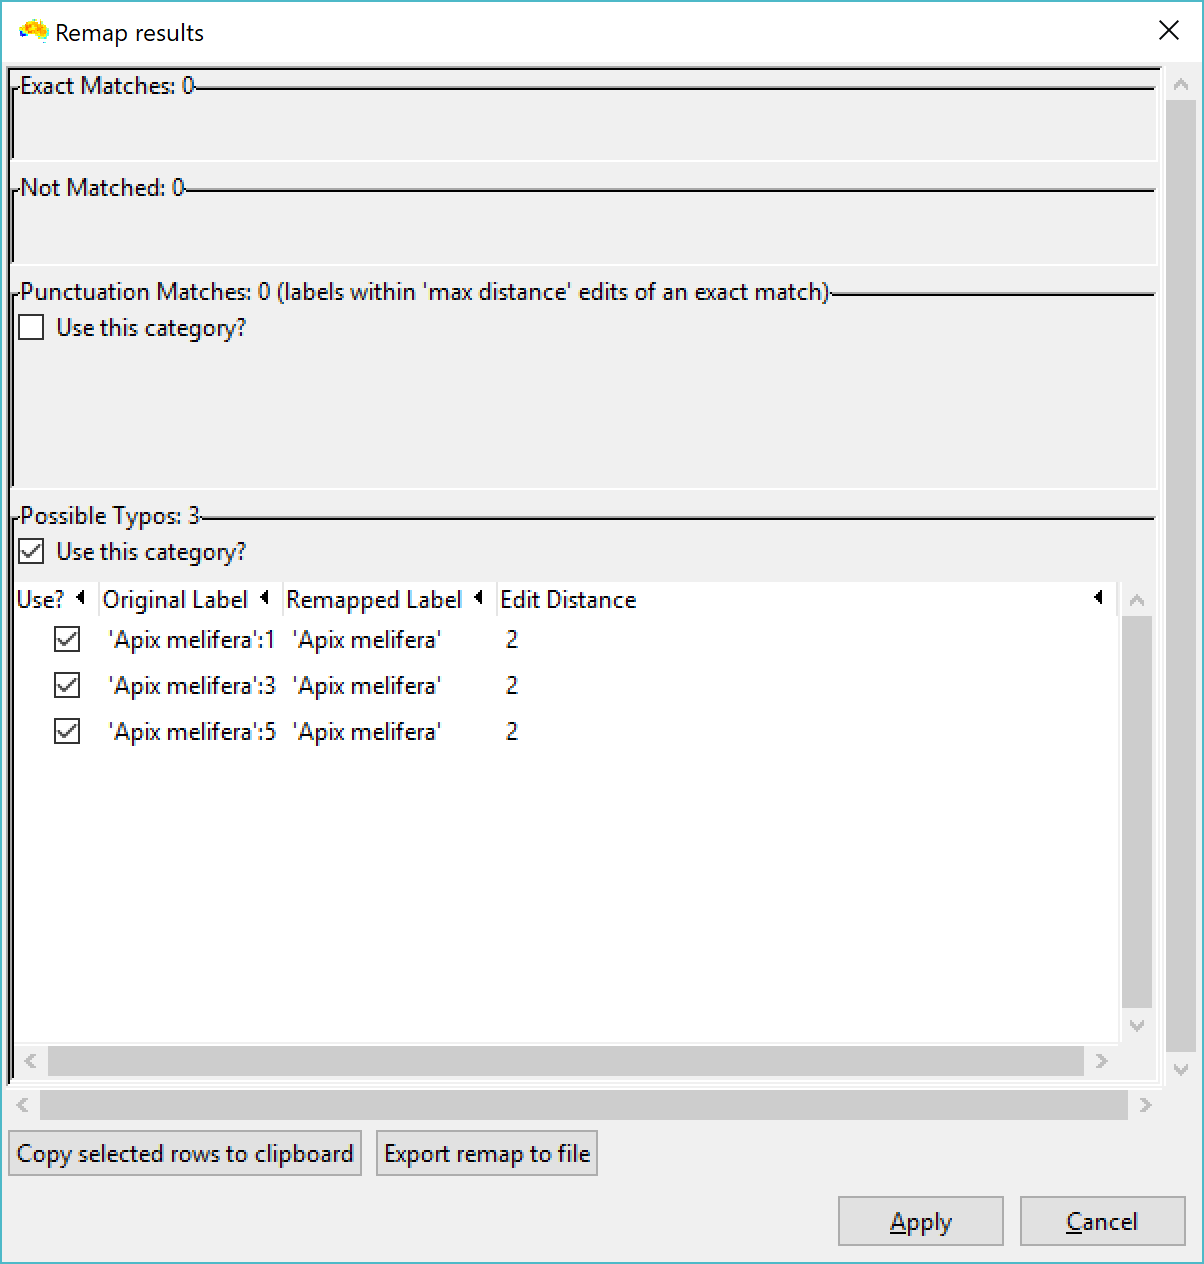
These labels the need to be renamed to remove the property values before you link them with a phylogeny that has species names only. To do this, use the "Remap element names" option from the file menu. Set your label source as "Auto from file", and the edit distance as 2 or 3 (screenshot 3). Then select your CSV file as the source. Then, after a few more screens in which you can select default options, you set the column with the species name as the input label. Click OK, and you should see your labels with property values will be collapsed (renamed) back to just species name (screenshot 4). The property values are removed from the labels in the basedata that is created.
More details about the remapping process are at https://biodiverse-analysis-software.blogspot.com/2017/04/matching-spatial-tree-matrix-and.html
I've also opened a new issue to remove axes from label and group names which would make the second part of this process simpler. https://github.com/shawnlaffan/biodiverse/issues/722
(2)
The second approach is to add columns to your input file to indicate species/property combinations you want to exclude. Use a value of 1 to denote exclusion, and 0 to not exclude. Then specify these as exclusion columns when you import your data.
More details are at https://github.com/shawnlaffan/biodiverse/wiki/SampleSession#data-are-not-in-matrix-format
Regards,
Shawn.
There are two options here.
(1)
The first approach is something of a workaround, and is to use the property values as a label axis when you import your data. The first two screenshots below are an example of what happens, using a data set of only the Apis mellifera samples from your screenshot
These labels the need to be renamed to remove the property values before you link them with a phylogeny that has species names only. To do this, use the "Remap element names" option from the file menu. Set your label source as "Auto from file", and the edit distance as 2 or 3 (screenshot 3). Then select your CSV file as the source. Then, after a few more screens in which you can select default options, you set the column with the species name as the input label. Click OK, and you should see your labels with property values will be collapsed (renamed) back to just species name (screenshot 4). The property values are removed from the labels in the basedata that is created.
More details about the remapping process are at https://biodiverse-analysis-software.blogspot.com/2017/04/matching-spatial-tree-matrix-and.html
I've also opened a new issue to remove axes from label and group names which would make the second part of this process simpler. https://github.com/shawnlaffan/biodiverse/issues/722
(2)
The second approach is to add columns to your input file to indicate species/property combinations you want to exclude. Use a value of 1 to denote exclusion, and 0 to not exclude. Then specify these as exclusion columns when you import your data.
More details are at https://github.com/shawnlaffan/biodiverse/wiki/SampleSession#data-are-not-in-matrix-format
Regards,
Shawn.
--
You received this message because you are subscribed to the Google Groups "Biodiverse Users" group.
To unsubscribe from this group and stop receiving emails from it, send an email to biodiverse-use...@googlegroups.com.
To post to this group, send email to biodiver...@googlegroups.com.
To view this discussion on the web visit https://groups.google.com/d/msgid/biodiverse-users/91e3e91a-6892-4be5-aeaa-0d2fd722b01f%40googlegroups.com.
For more options, visit https://groups.google.com/d/optout.
--
Assoc Prof Shawn Laffan
  School of Biological, Earth and Environmental Sciences
  UNSW, Sydney 2052, Australia
  Tel +61 2 9385 8093
  http://www.bees.unsw.edu.au/staff/shawn-laffan
  https://shawnlaffan.github.io/biodiverse (free diversity analysis software)

  Editor, International Journal of Geographical Information Science
  http://www.tandf.co.uk/journals/ijgis

  UNSW CRICOS Provider Code 00098G
thenewb...@gmail.com
Mar 1, 2019, 1:59:26 PM3/1/19
to Biodiverse Users
Thank you!
It was very useful, but one more time I have a problem and It is because it doesn´t match every labels like in image 1, i have tried some high numbers like 20 in The Maximum acceptable distance, but it doesn´t work. I don´t know what to do.
In the Image I have selected a value of 15.
Shawn Laffan
Mar 1, 2019, 7:12:51 PM3/1/19
to biodiver...@googlegroups.com
I think in this case it is simpler to use a different approach to the two I outlined in my previous response.
In this case, once you have imported your data and removed the combinations you no longer need, export your data to a csv file (Basedata menu > Export groups), and then re-import that file, but do not specify the column that represents the property name when you do so.
Some points to note:
The column names in the exported file will actually be and Axis_0, Axis_1.
You will need to specify that your data are in matrix format, as the default export is for that type.
You will also need to transpose the matrix after import, as the coordinate names will be used as the labels in this approach.
You might also need to clean up the quotes.
To be honest, though, all of the above is somewhat fiddly. If your data are relatively simple and not overly large then it is perhaps best to use the filters in Excel to generate different input data sets, and import each one in turn. If you are familiar with R (or similar) then you could use it to filter the data into separate data frames and then export these as CSV files.
Regards,
Shawn.
--
You received this message because you are subscribed to the Google Groups "Biodiverse Users" group.
To unsubscribe from this group and stop receiving emails from it, send an email to biodiverse-use...@googlegroups.com.
To post to this group, send email to biodiver...@googlegroups.com.
To view this discussion on the web visit https://groups.google.com/d/msgid/biodiverse-users/9fc8339c-a151-46e8-84b9-cfc2f7b7b096%40googlegroups.com.
Reply all
Reply to author
Forward
0 new messages