Interpreting Tracer output - turnoverFBD - FBD divergence time estimation
26 views
Skip to first unread message

Nadya
Nov 13, 2022, 1:35:03 PM11/13/22
to beast-users
Hi all,

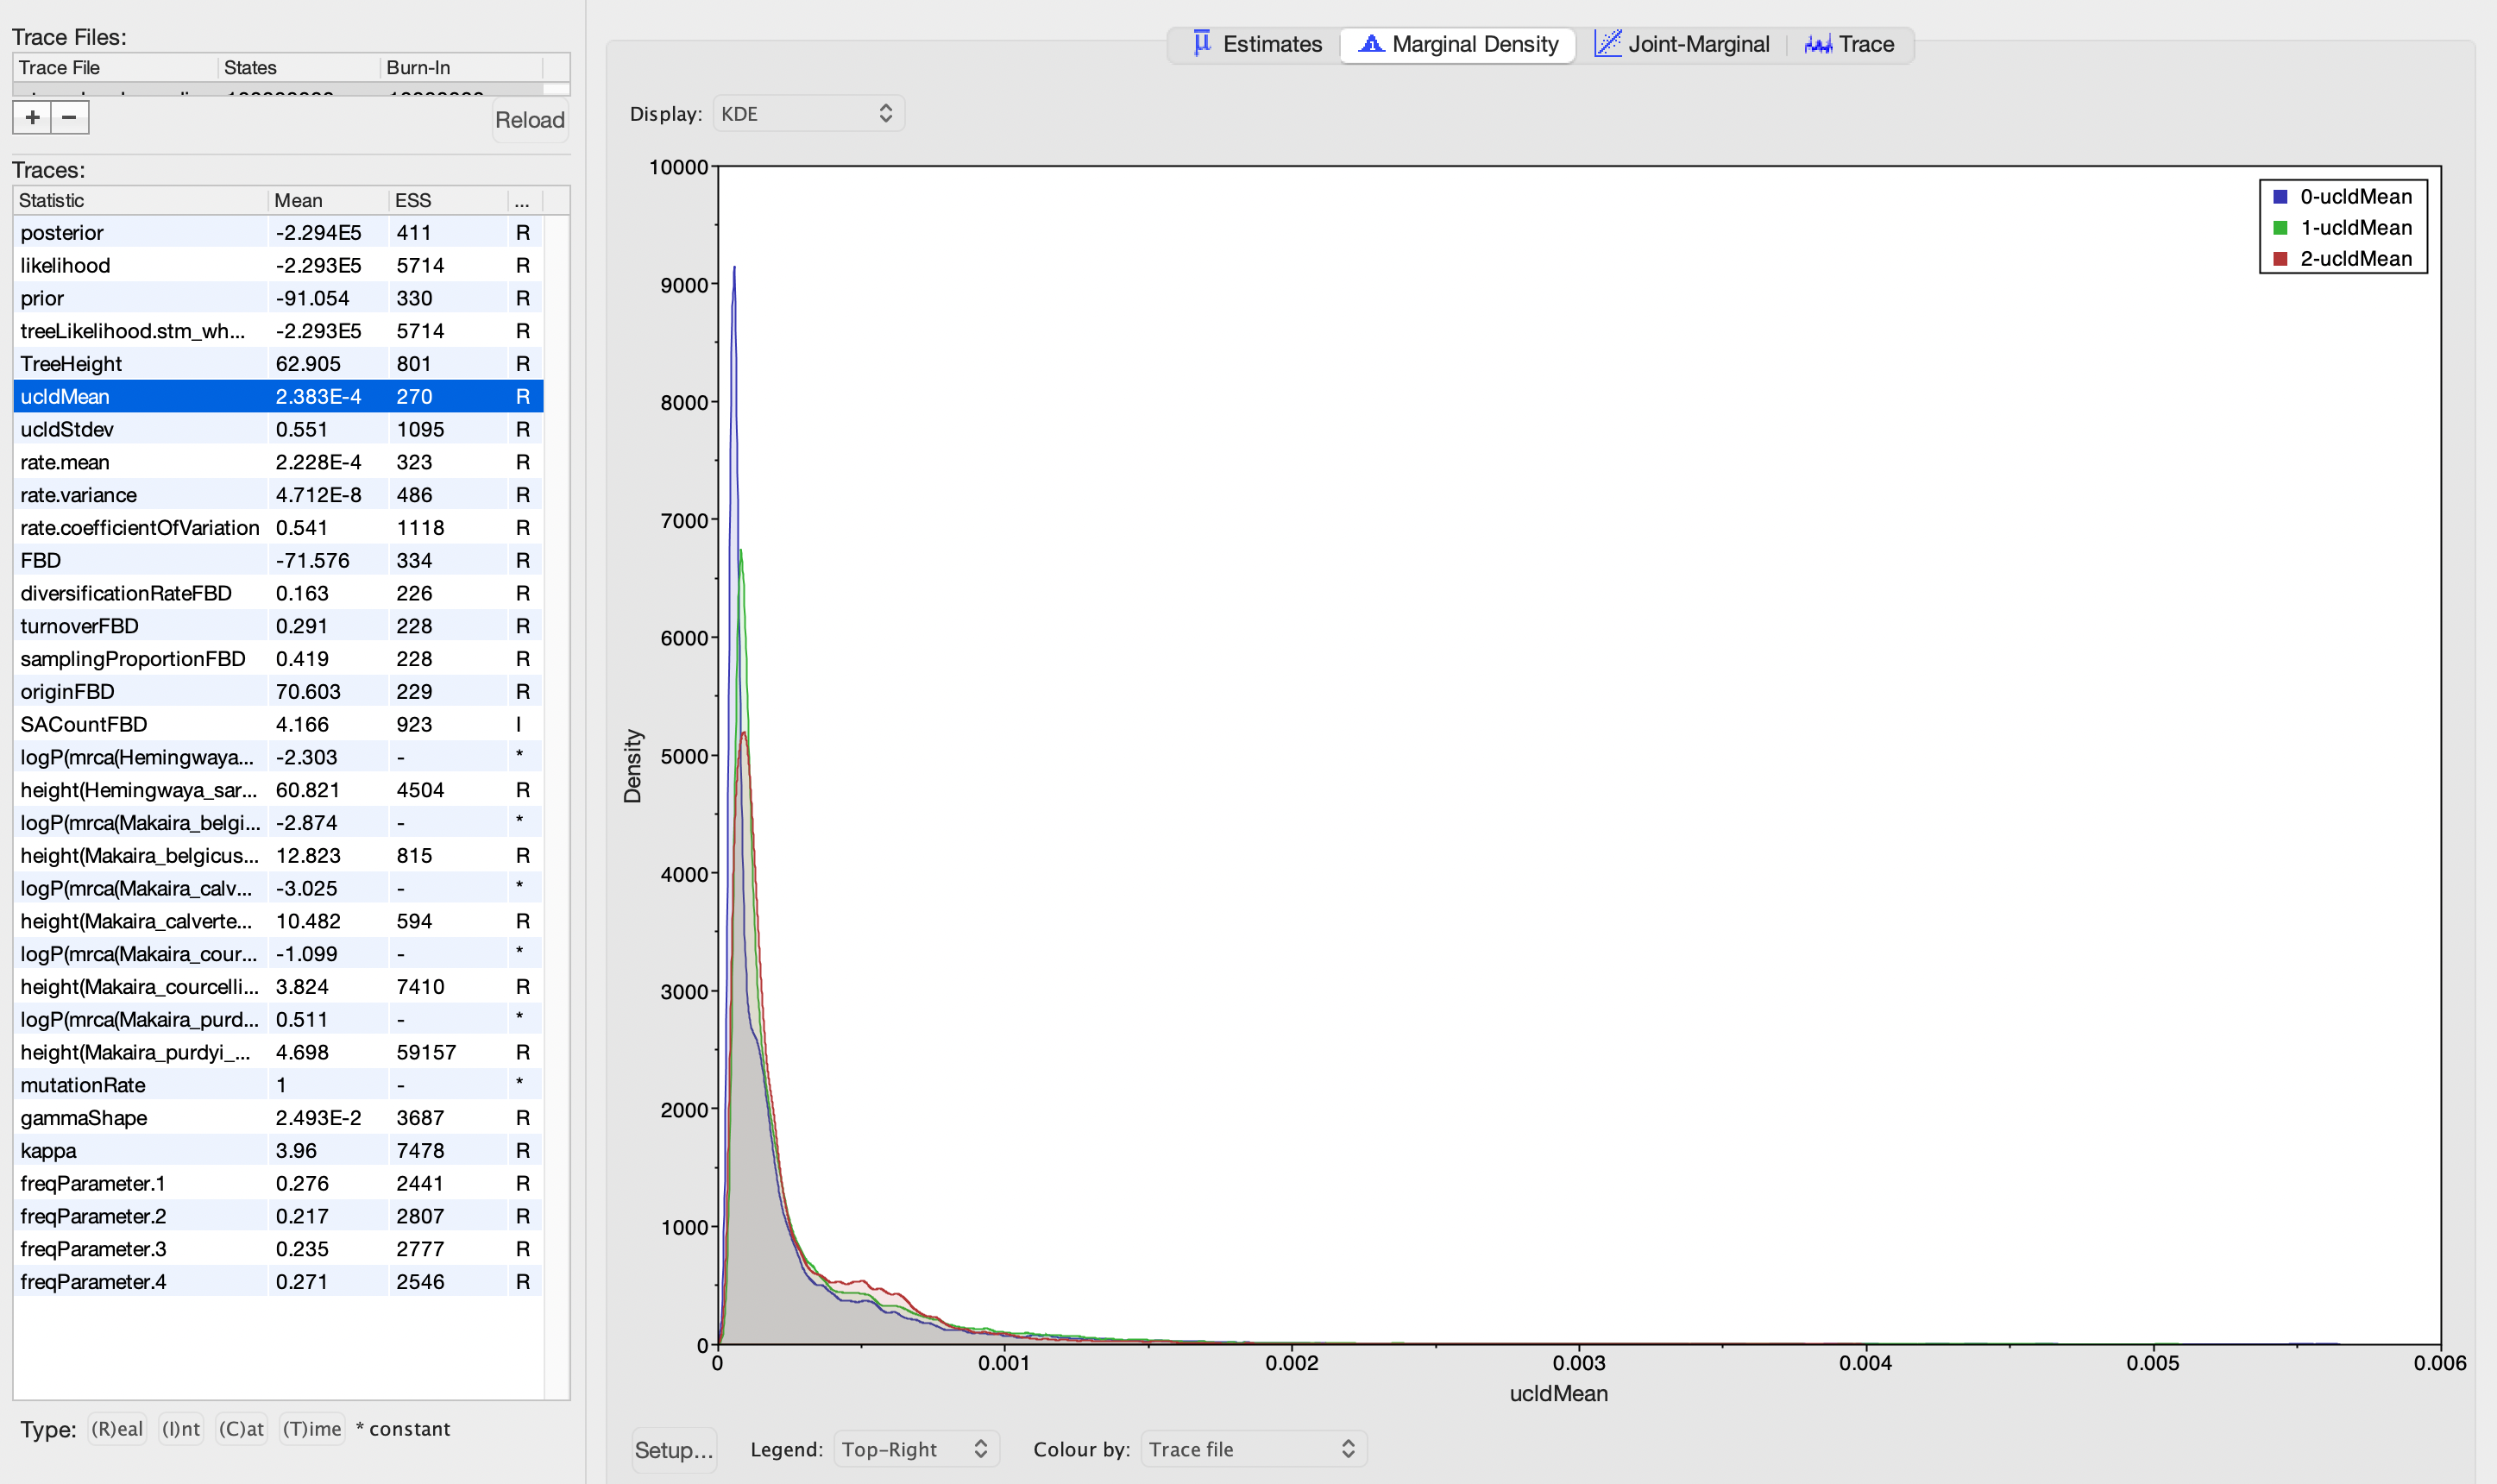
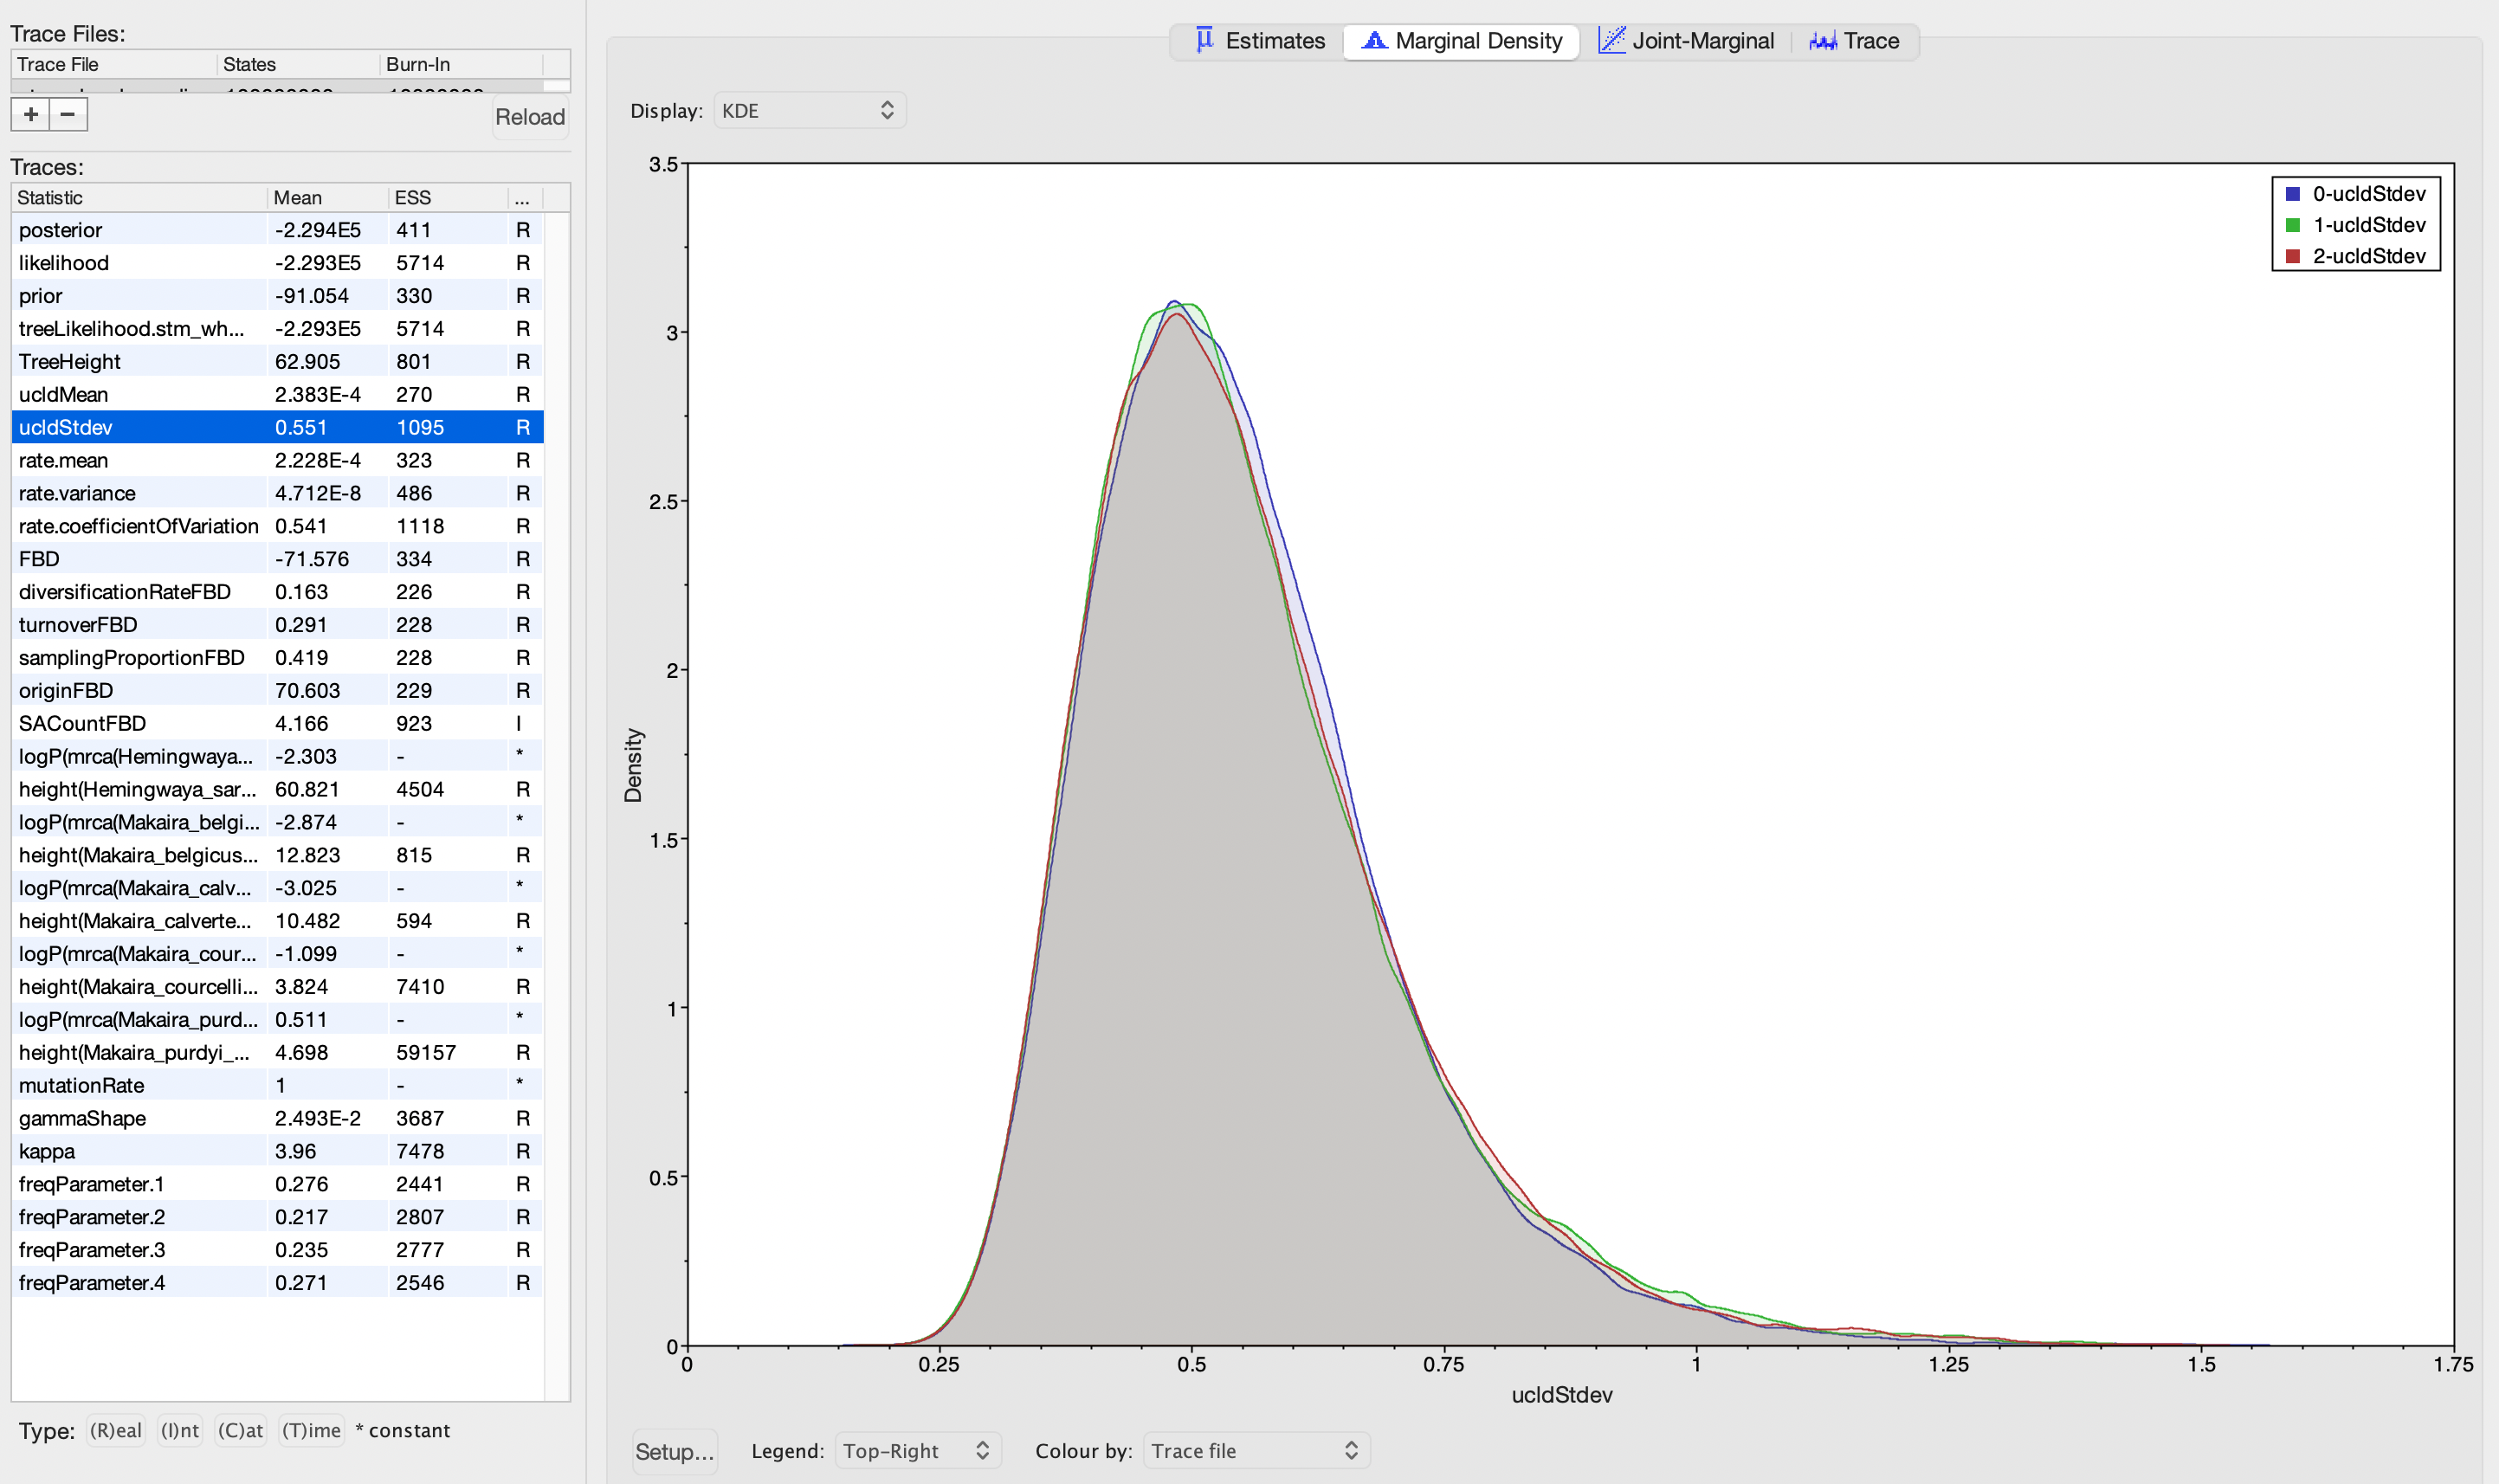
I'm using BEAST v2 to estimate divergence time using the FBD process from a dataset that comprises genome-wide SNPs plus their flanking sequences. I've completed three independent runs of the analysis, using a relaxed clock log normal model. I've inspected the output of these runs in Tracer, and the ESS for all of the model parameters looks great. The posterior distributions for ucldMean and ucldStdev are also very similar across runs (see screenshots below). However, I noticed the distributions for turnoverFBD are quite different across runs. But, I'm not sure what this means for the analysis. Is it indicative of anything I should consider exploring or changing about the analysis?
Thanks for any thoughts!
Nadya
Reply all
Reply to author
Forward
0 new messages