Plot variable from Netcdf file
25 views
Skip to first unread message

jean-marc belanger
Oct 12, 2022, 9:29:55 AM10/12/22
to autoplot
Hi everyone,
I've recently discovered Autoplot on the web. I used it to plot ascii (.csv) time series
and was very impressed by the features of this application !
Now I'm trying to plot a time slice of a variable (tcwv) from the Netcdf file (era5_tcwv_e16.nc) shown below. I don't know how to select a specific time (first dimension of the 3d array) to display a map of the atmospheric total water vapor content
(tcwv). I succeeded previously with a 2d variable (lat,lon) but now I don't know how
to select a time slice in the GUI. It would also be very useful to have an example script
to load the data and plot specific times to create PNG images.
Any suggestions how to do that interactively and programmatically (jython script) ?
Thanks,
Regards,
Jean-Marc
--------------------------------------------------------------------------------------------------------------------------
ncdump -h era5_tcwv_e16.nc
netcdf era5_tcwv_e16 {
dimensions:
longitude = 1440 ;
latitude = 721 ;
time = 2208 ;
variables:
float longitude(longitude) ;
longitude:units = "degrees_east" ;
longitude:long_name = "longitude" ;
float latitude(latitude) ;
latitude:units = "degrees_north" ;
latitude:long_name = "latitude" ;
int time(time) ;
time:units = "hours since 1900-01-01 00:00:00.0" ;
time:long_name = "time" ;
time:calendar = "gregorian" ;
short tcwv(time, latitude, longitude) ;
tcwv:scale_factor = 0.00140885921281868 ;
tcwv:add_offset = 46.2137274467103 ;
tcwv:_FillValue = -32767s ;
tcwv:missing_value = -32767s ;
tcwv:units = "kg m**-2" ;
tcwv:long_name = "Total column water vapour" ;
tcwv:standard_name = "lwe_thickness_of_atmosphere_mass_content_of_water_vapor" ;
// global attributes:
:Conventions = "CF-1.6" ;
:history = "2020-09-28 17:46:10 GMT by grib_to_netcdf-2.16.0: /opt/ecmwf/eccodes/bin/grib_to_netcdf -S param -o /cache/data5/adaptor.mars.internal-1601314937.3760412-21322-24-bf082161-50a1-41e3-8f48-da1135a9dfaf.nc /cache/tmp/bf082161-50a1-41e3-8f48-da1135a9dfaf-adaptor.mars.internal-1601314937.3766353-21322-9-tmp.grib" ;
}

Jeremy
Oct 12, 2022, 9:40:18 AM10/12/22
to autoplot
Hello Jean-Marc and welcome,

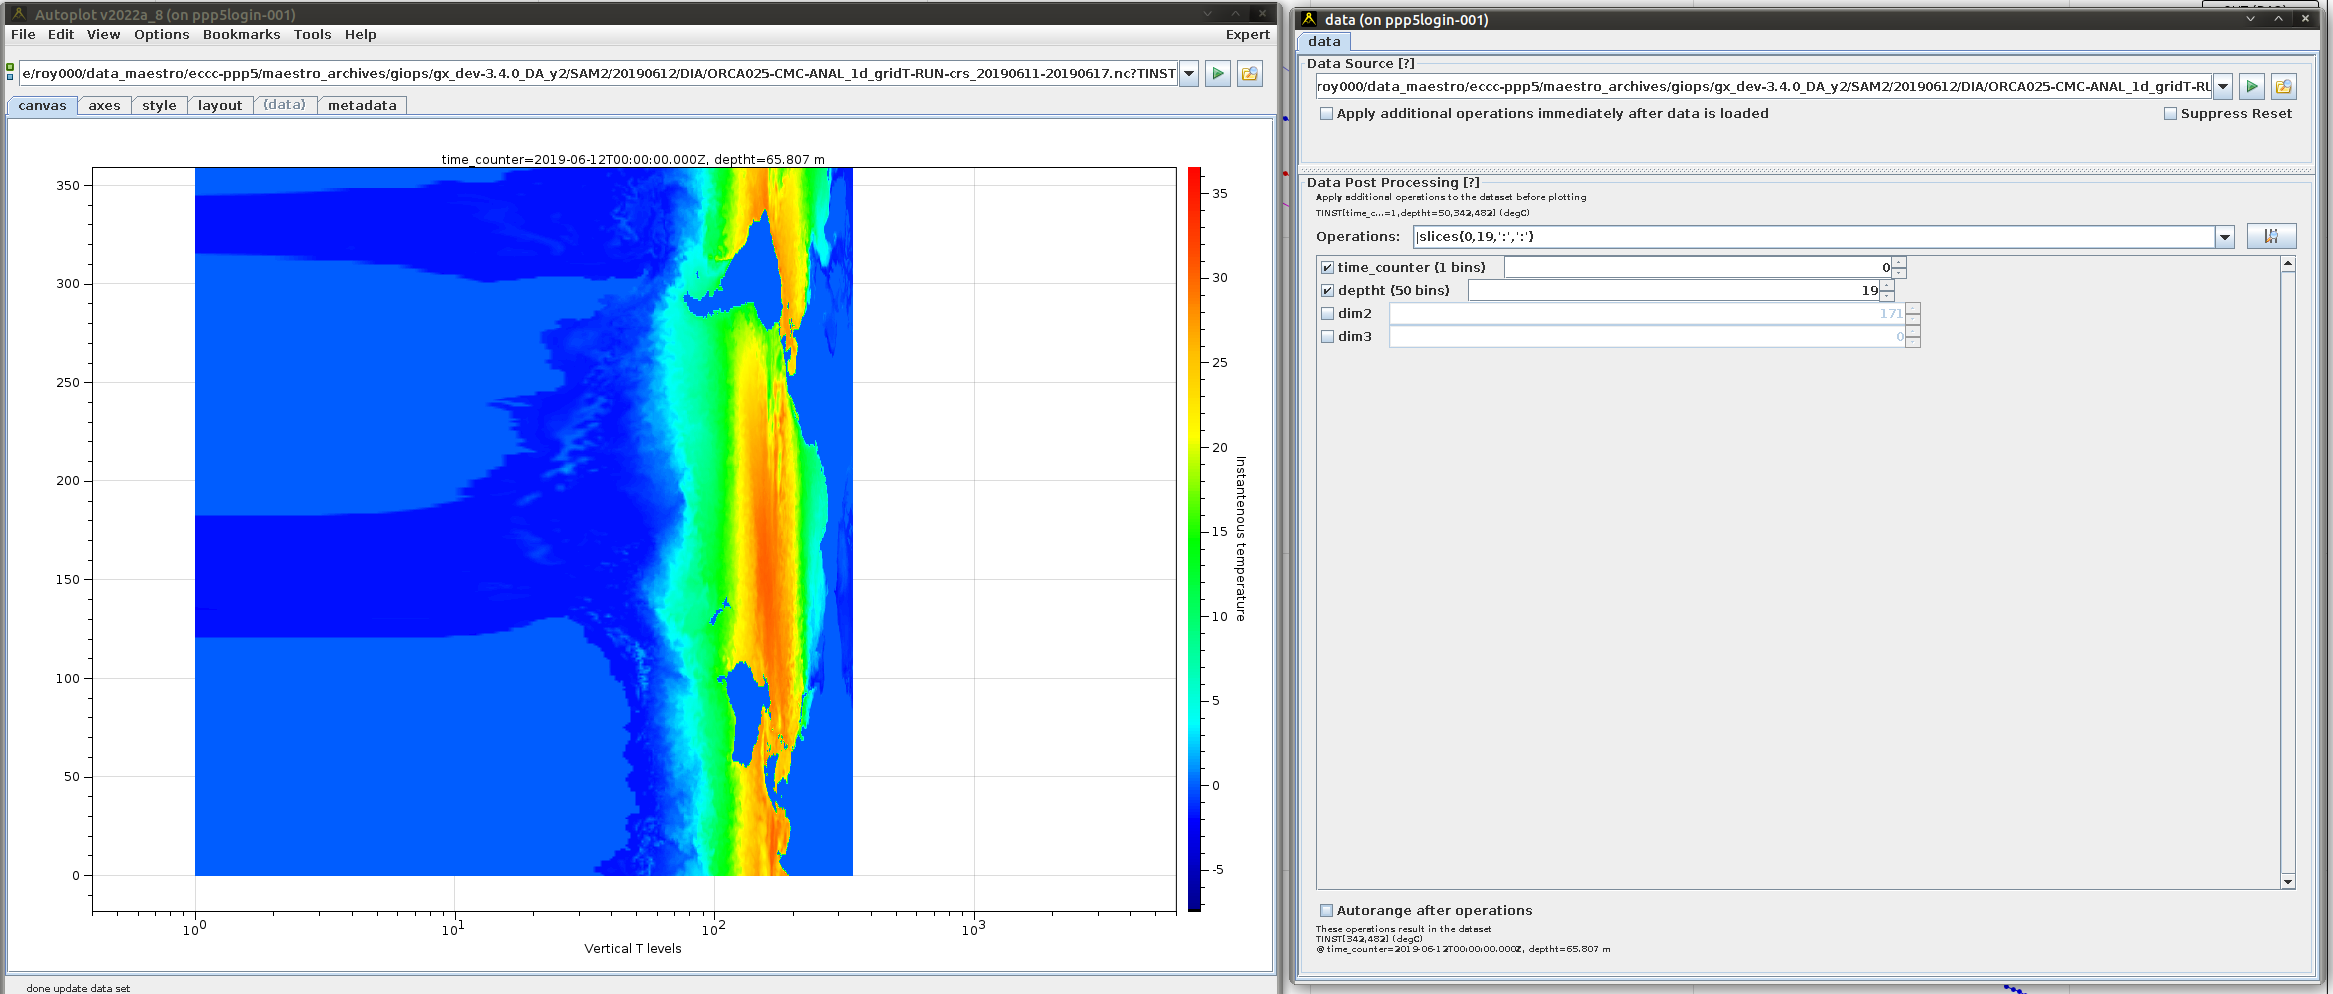
When you plot a URI which results in a "rank 3" (or 3-index) data set, Autoplot decides which dimension it will "slice" on to create something it can plot. "lat" and "long" are magic strings it looks for, and it should slice on the remaining index time automatically. If it doesn't do this, then you can go over to the "data" tab, where you can set the slice index to be the first (time). Also note while this is generally an index, the slice routine will also allow a formatted time to be there, so you should be able to enter a specific time. Please let me know if this is not the case for you.
For example, plot the URI http://autoplot.org/data/sst.wkmean.1990-present.nc?sst (sea surface temperature over time). You should see that Autoplot has recognized the dimensions and sliced on time. On the data tab (which I've undocked in the attached image) you can see where I've selected the time on the right and changed it to a time in 1987.
Jeremy
jean-marc belanger
Oct 14, 2022, 10:44:44 AM10/14/22
to autoplot
Hi Jeremy,
This is truly great. I don't know what happened the first time but
my next shot at it after your email I had no problem with 3d and 4d
variables ! I can see autoplot seems to be figuring out the data
quickly and proposing an initial slice (images below).
1) I would like to be able to do some batch processing so it would
be very useful to rely on a few example scripts along with a
documentation (http://autoplot.org/developer.scripting ?) to start writing
code for my specific needs (similar to what people are doing in the python
universe with jupyter Notebooks).
Some applications let you save code to a file, when in interactive
mode (sort of recording the session), which can be edited and launch
later in batch (ex. Robert Schmunk's Panoply at NASA,
https://www.giss.nasa.gov/tools/panoply/)). Is it a feature of autoplot,
recording jython code ?
2) I have come across some examples but to your knowledge, are there
any existing examples that would be close to what I'm looking for,
that is load Netcdf file(s),essentialy 3d or 4d meteorological or
oceanographic fields, and create png images or movies of slices ?
3) I mentionned Panoply above, it is a Java based application. I wonder
if a few tricks could be borrowed/imported from Panoply like 2D
"georeferenced" map on the globe ? :-) For an atmosphere/ocean scientist
this is an important feature to have but I understand that it would be
less useful for space physics (which appears to be the natural habitat for
autoplot) :-)
I feel there's a lot to learn about autoplot. I hope I have time to go through some
of your presentations and papers.
Jean-Marc
A 3d case:

A 4d case:
Jeremy
Nov 15, 2022, 8:41:12 AM11/15/22
to autoplot
Hello Jean-Marc,
Sorry I missed your email! I'll answer in case it's still useful to you.
I've found creating documentation for scripting to be challenging. There are a bunch of resources you can look at but no "getting started" manual that seems to be effective. This is my last attempt, and should probably be considered the official version: https://github.com/autoplot/documentation/wiki/scripting. https://github.com/autoplot/dev/ is a repository of hundreds of example scripts, where I write scripts to demo bugs (and then fix the bug!) or to demo features.
I'll have a look at Panoply, I wasn't aware of it and I'm very interested in the Jupiter notebooks. It's been suggested to me that Autoplot's scripting could be adopted to this environment, but I haven't explored that yet.
Last, you asked about creating movies, and I have played with this. For example, the script https://github.com/autoplot/dev/blob/master/demos/2019/20190611/makeMovie.jy loads in the jcodec library and writes an mp4. Maven central, which hosted the jcodec jar files, seems to have changed and the script is not working right now, I find. I'll track the jar files down and correct the script a little later today.
Thanks again for your interest!
Thanks again for your interest!
Jeremy
jean-marc belanger
Nov 15, 2022, 12:27:05 PM11/15/22
to autoplot
Hi Jeremy,
Yes, I managed to write some simple scripts using the different
web pages (developer.scripting, cookbook, script.cookbook,...,etc).
[You mentionned Jupyter notebooks, I don't have a long experience
with python and even less with java (jython) but it seems to me
that a major hurdle for this is the lack of support for python
libraries like numpy. Just yesterday I was trying to use a 2d array
(numpy) in a Jython script. I found myself looking for solution
like JyNI(2014), JPyPe, ... It seems as if this avenue has not really
taken off ? I may be mistaken here.]
Apart from scripting, I tried your PNG walker. This is a very very useful
tool. In R&D (numerical weather prediction model) we find ourselves generating
a lot of images from our model forecasts and we end up repeatingly recreating
web page (javascript) to browse and share these images. Lately instead of
creating the html page I've been using PNGwalkerTool to load directory of images.
I have look elsewhere and I haven't found anything as useful so quickly and
I'm sure I haven't experimented all its features yet.
The GUI with its multiple option tabs (Single, Grid, ContextFlow,FilmStrip,Covers)
is really neat. I especially like Covers since, with one look, it can uncover
patterns in time (time sequence of images) or space (model vertical levels series).
I can think of a feature that would be a very nice addition to the PNGwalkerTool,
the possibility to display 2 or more concurrent image streams in the GUI next to
each other for visual comparison (the arrows are used to travel back and forth
in the different streams simultaneously since the streams index (ex. date) would
be the same). I have used multiple PNGWalker windows to compare maps of model
results at different levels, for example, but then you cannot browse both image series
without constantly switching windows to advance both streams at the same date.
Then, after exploring a zillion images, often come the next step where you want to
share findings with colleagues. Then it's the process of selecting images to tell
a story for others to see ... the html page and javascript editing. I noticed your
Write_to_html menu item (Tool Tab) but I haven't seen what it can do. Maybe later ...
Thanks !
JM
Jeremy
Nov 15, 2022, 1:03:39 PM11/15/22
to autoplot
I don't know if you've played with the bindings much, but it's a central part of Autoplot. (In the GUI, try right-clicking on the y-axis and bind the scale to the opposite axis. You'll see the two axes will always have the same scale now, and changing one will change the other.) You can bind two PNGWalkTools together, but this must be done with a script. See https://github.com/autoplot/dev/blob/master/demos/2020/20200227/bindTwoPngwalks.jy for more on this. This will probably require that you can template the png file names (like $Y$m$d.png) so that it knows the time span for each image, and then you would bind the two timeRange properties together. Or the binding can be by file name, if the files are named the same way.
Yes, you are right that NumPy libraries aren't available. Jython 2.7 starts to bridge over to them, but I'm nervous about getting too invested in it while Python 3 is widely accepted. If you have a specific need, let me know here or by emailing me directly (faden at cottagesystems.com), and I can work with you to find a solution. There's an Apache Math library which is built-in to Autoplot which has quite a lot in it, most of which I haven't explored. In general I've been able to find a Java code that implements, and bringing it into Jython is fairly straight-forward.
Jeremy
Jeremy
Nov 15, 2022, 1:17:44 PM11/15/22
to autoplot
Also with the PNG Walk Tool, note the oddly-named "Quality Control" feature, which lets you add notes to images and mark them as "OK" or "Problem". This is a really useful feature for workflows like you describe were you need to find the interesting images from zillions. I should also make it easier to bind two pngwalks together. This would be useful to lots of people, I agree, and it would be nice if scripting wasn't required.
Jeremy
jean-marc belanger
Nov 15, 2022, 2:49:05 PM11/15/22
to autoplot
1) Nope, I haven't had the chance to try the bindings.
2) As far as the PNGWalk is concerned I mostly played with PNGWalkTool interactively and
using the fact that images directory are cached and can be recalled easily.
Looking at your suggestion (bindTwoPngwalks.jy )
p1= getParam('pngwalk1',URI('http://autoplot.org/data/pngwalk/product.pngwalk'))
p2= getParam('pngwalk2',URI('http://autoplot.org/data/pngwalk/product.pngwalk'))
I can see that I need to go trough the CreatePNGWalk menu item first and save the two "products"
to be compared later ? And then select Run Batch (bindTwoPngwalks.jy ) in interactive mode to
get to the point I was referring to earlier ... OK I'm talking to myself now ...:-) I will try that later.
3) About the Write_Html ... does that mean that if I use the QC feature to select images that selection (only)
could end up in the html page somehow ?
Sorry. Again, questions ... questions ... questions!
Cheers,
JM
PS: From what I have experienced up to now, another aspect of Autoplot I think has been carefully designed is the treatment of dates, loading of files, and guesswork ... this sets the application apart as far as I'm concerned!
Jeremy Faden Gmail
Nov 15, 2022, 2:55:26 PM11/15/22
to auto...@googlegroups.com, jean-marc belanger
Hi Jean Marc,
I'll respond to you directly and then summarize for the group later.
Jeremy
--
You received this message because you are subscribed to the Google Groups "autoplot" group.
To unsubscribe from this group and stop receiving emails from it, send an email to autoplot+u...@googlegroups.com.
To view this discussion on the web visit https://groups.google.com/d/msgid/autoplot/8493258e-a655-44a0-af13-dd190db2a881n%40googlegroups.com.
Reply all
Reply to author
Forward
0 new messages