tpmap results
27 views
Skip to first unread message

Jeffrey Trevino
Dec 11, 2011, 1:27:58 AM12/11/11
to athenacl
I have a question about the tpmap command - does it always graph default parameters, or does it graph the parameter with the arguments that you give it?
Here's a sample from my session:
pi{}ti{} :: tpmap 60 ws, t, 6, 0, 600, 12000
waveSine, event, (constant, 30), 0, (constant, 0),
(constant, 1)
TPmap display complete.
It gives me a picture of value that range between 0 and 1, not between 600 and 12000. Also, it printed out arguments different from the ones I entered immediately after I entered them. Do I need to do something special to look at a graph of the arguments I entered? I'm not sure what the problem is - I suspect it might be something with my misunderstanding of the "time" vs "event" string in the second argument, or the requirement that tpmap knows the number of "events," rather than a number of seconds.
thanks for your attention,
Jeff
--
《〠》】〶【〖〠〗〶〛〷〚
Jeff Treviño
PhD Candidate in Music Composition
@ the University of California, San Diego
〖〠〗〶〛〷〚《〠》】〶
Skype: jeffreytrevino
E-mail: jeffrey...@gmail.com
〚《〠》】〶【〖〠〗〶〛〷
9310H Redwood Dr.
La Jolla, CA 92037
USA
〖〠〗〶〛〷〚《〠》】〶【

christopher ariza
Dec 11, 2011, 10:37:24 AM12/11/11
to athe...@googlegroups.com
good question.
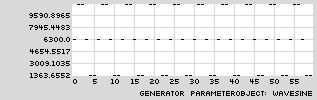
the problem is that, for various reasons, when using tpmap as a single command from the command-line, you cannot have any spaces between the arguments of the parameterObject. thus, in the following examples you can see the properly labeled y axis and the change in frequency:
pi{}ti{} :: tpmap 60 ws,t,6,0,600,12000
Reply all
Reply to author
Forward
0 new messages