Canvas flood fill an area
1,820 views
Skip to first unread message

Scott Ferguson
Jan 31, 2014, 12:38:06 PM1/31/14
to
YouTube video: http://youtu.be/j9XmhYavnZU

Changes log:
140131:
Optimized Sort further -- seconds to fill ->
Blue Yellow Green Red
ASUS TF-101 1 2 3 6
NextBook 7" 3 4 5 12
Updated aia and apk files
140128:
Tweaked BubbleSort
Some times to fill areas on the above picture on my ASUS TF-101 tablet:
Blue area - 1 second
Yellow area = 2 seconds
Green area - 3 seconds
red area - 6 seconds
Tested Shell sort, insertion sort
Shell sort is about 60% faster than bubble sort, but it does not fill completely
Insertion sort is a bit slower than bubble sort
New aia source is still version 2.0
140127:
Removed the number to integer text conversion. It was not necessary.
New project version is 2.0
Some times to fill areas on the above picture on my $69 Nextbook 7" tablet:
Blue area - 3 seconds
Yellow area - 5 seconds
Green area - 7 seconds
red area - 14 seconds
140125:
'Nanobot' concept dropped in favor of simpler X, Y, H values.
Changed the method from boundary fill to flood fill -- boundary color determined by the fill procedure.
The developer must provide any x,y location inside the area to fill and a fill color.
140122:
Lookup tables for offsets to color sensors replaced with trigonometry sin and cos functions.
140120:
Nanobot redesigned - now consists of main body, left color sensor, front color sensor for detecting the boundary to the left and front;
Left color sensor was moved from diagonal left-front position to left side of the body;
logic for filling was modified and simplified to reflect the new design
performance is too slow - your help is needed to improve efficiency and speed of any of the steps outlined below
140118: 1st DRAFT
===
- building a list of points along the perimeter of the area
- sorting the points
- filling the figure
Any drawn picture or BackgroundImage can be used, but the color to be filled must be a simple solid color.
If the color contains a transparency value other than 255, the new fill color will blend with the existing color in the fill area.
These 3 steps to build, sort then fill are described in detail below:
1. building a list of points inside the figure boundary
This is accomplished by using the left-hand rule of maze solving.
After the initial touch at the x,y location to be filled, the BackgroundPixelColor is determined and the canvas is scanned to the right until the color changes.
This marks the StartX, StartY of the edge of the area to be filled.
From this point on, the edge is followed in a clockwise direction by advancing X and Y and keeping track of the current heading H which is initially 270 (South).
The heading H value changes by 90 degree increments as the edge is followed.
These will always be 0 (right),90 (up),180 (left), or 270 degrees (down).
Whenever H is 270, a right point should be stored.
Whenever H is 90, a left point should be stored.
This will allow the DrawLine block to be used to fill the area later.
Two lists are used to store these points - LeftPoints and RightPoints.
When StartX, StartY and the starting H (270) have been reached again, the lists are complete and the entire perimeter has been followed.
You can skip to the Sorting section now unless you wish to understand how the edge of the area to be filled is followed below.
Following the edge of an area using BackgroundPixelColor
X and Y represent the location of the current pixel on the canvas inside the area to be filled.
Associated with this location or point are locations in front of (F) and to the left (L) of X,Y that are used to read the current BackgroundPixelColor.
In addition, these locations rotate around the X,Y position as the heading value H changes.
Using X,Y and H a routine can be used to follow the perimeter of the area to be filled.
As the perimeter is followed, the two lists of points created will later be sorted and used as arguments to the Canvas Drawline block in order to fill the figure with a specified color.
A conceptual model of the three pixels involved might look like the following:
a virtual body N, a left color sensor L, a front sensor F:
L
NF
In this example, F is to the right of N so the model is facing right or 0 degrees.
It's location on the Canvas and current heading are required to know the position of it's two color sensors at any time.
These values are stored in three variables:
X, Y, H
The convention for App Inventor's canvas for sprites (ImageSprite, Ball) is that their Heading property values start at 0 degrees (right), and increase in value in a counter-clockwise direction so 0 degrees is to the right, 90 degrees is up, 180 degrees is to the left and 270 degrees is down.
These are the only angles that are required.
When the heading H changes, it is by +90 degrees (counter-clockwise) or -90 degrees (clockwise) only.
When the X,Y location changes, it is by one-pixel increments and the current heading H determines how X or Y are changed as explained below.
For the following values of H the relative locations of L and F can be seen
0: L 90: F 180: FN 270: NL
NF LN L F
This can be shown in the following example:
H = 0:
(4,2)
/
L
NF
/ \
(4,3) (5,3)
Only the location of N (X,Y) and H are known, but the locations of L and F can be derived from these as offsets from N's location:
These values can be obtained with App Inventor's Math sin(H) and cos(H) functions:
H 0 90 180 270
sin(H) 0 1 0 -1
cos(H) 1 0 -1 0
-sin(H) 0 -1 0 1
-cos(H) -1 0 1 0
If N's location is at (4,3) on the Canvas then L and F are located at the following offsets from N
H = 0
L
NF
L (4 + 0,3 - 1) Lo (0,-1); -sin(0) = 0, -cos(0) = -1
F (4 + 1,3 + 0) Fo (1,0); cos(0) = 1, -sin(0) = 0
H = 90
F
LN
Lo (-1,0); -sin(90) = -1, -cos(90) = 0
Fo (0,-1); cos(90) = 0, -sin(90) = -1
H = 180
FN
L
Lo (0,1); -sin(180) = 0, -cos(180) = 1
Fo (-1,0); cos(180) = -1, -sin(180) = 0
H = 270
NL
F
Lo (1,0); -sin(270) = 1, -cos(270) = 0
Fo (0,1); cos(270) = 0, -sin(270) = 1
The same method used to rotate the 'color sensor' L and F pixels around N's X,Y location is used to move N a pixel to the right, left, up or down by adding or subtracting pixels to the X and Y values.
To move the X,Y location one pixel based on the current H:
set X to X + cos(H)
set Y to Y - sin(H)
If X,Y is 4,3 and H = 90:
then 4 + cos(90) = 4 and 3 - sin(90) = 2
so the new X,Y location is 4,2
===
General logic for following the edge:
Whenever L is outside the area to be filled, then a point may need to be added to the LeftPoints (H = 90) or RightPoints (H = 270)list.
Note: in the examples below, the O's represent a different color outside of the area to fill.
N is always inside the area to fill.
Before:
Color under L is not the inside color and color under F is the inside color
(following straight edge) .
..OOLOO..
NF
(L is over an O)
After:
..OOOLO..
NF
Before:
Color under L is inside color
(outside corner)
:
O
O
..OOOL
NF
(L is not over an O)
After:
Color under L is outside color
:
O
OF
..OOLN
(L is over an O)
Before:
Color under L is not the inside color and color under F is not the inside color.
(inside corner)
..OOOLO
NF
O
O
:
(L and F are over Os)
After:
..OOOOO
NL
FO
O
:
(L is over an O)
===
END Following the edge of an area using BackgroundPixelColor
2. Sorting the LeftPoints and RightPoints lists with the procedure SortOrderedPairsByYThenX.
The two lists built in step 1 contain left and right points for the lines to fill the figure.
These lists are called LeftPoints and RightPoints as the lines will be drawn left-to-right.
When following the edge of the fill area, if H = 90 (pointing up), points are added to LeftPoints. When H = 270, (pointing down), points are added to RightPoints.
No points are added when H = 180 or 0.
Once the points have all been added to the two lists, they must be sorted first by the lowest to highest y value, then by the lowest to highest x value.
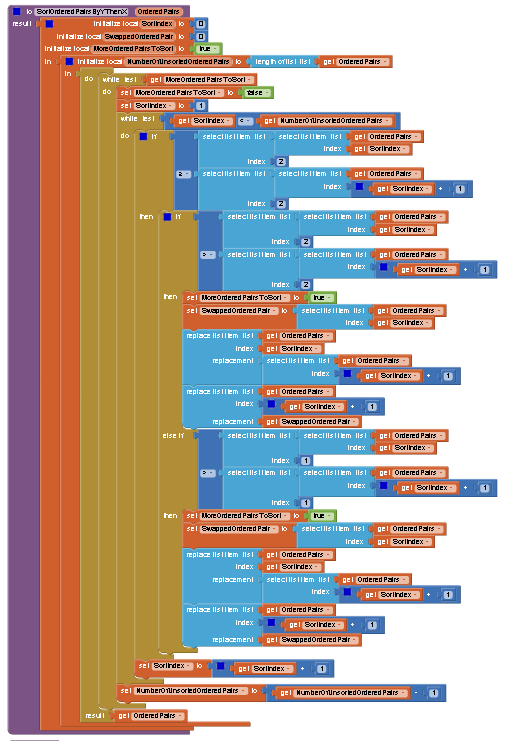
In Step 3, the sorted points will be used as arguments to the Canvas DrawLine block to fill the figure with the DrawLine.Timer block.
===
END Sorting the LeftPoints and RightPoints lists
3. Filling the figure with LeftPoints, RightPoints and the Canvas DrawLine block
Once all endpoints needed by the DrawLine block are sorted, a simple loop can be used to draw each line to fill the figure.
I noticed that the Right endpoint causes the lines to stop one pixel away from the right edge of a figure.
To correct this I added one pixel to the right side of each line as the Rightpoints list was being built.

===
END Filling the figure

Esta Cervexa
Jul 1, 2015, 8:57:46 AM7/1/15
to app-inventor-de...@googlegroups.com
Hi,
The app is great. I wanted to bulid an application like this one.
Regards,
Esta Cervexa
Jul 1, 2015, 10:24:00 AM7/1/15
to app-inventor-de...@googlegroups.com
Hi there,
May I use code/blocks for commercial use. It will be deliver as free of charge (google store).
Regards,
Jacek
--
(you have received this message from the App Inventor Developers Library)
---
You received this message because you are subscribed to a topic in the Google Groups "App Inventor Developers Library" group.
To unsubscribe from this topic, visit https://groups.google.com/d/topic/app-inventor-developers-library/NBuCEDP8SxQ/unsubscribe.
To unsubscribe from this group and all its topics, send an email to app-inventor-develope...@googlegroups.com.
For more options, visit https://groups.google.com/d/optout.
Scott Ferguson
Jul 1, 2015, 2:47:12 PM7/1/15
to app-inventor-de...@googlegroups.com, estac...@gmail.com
Anything that I have developed here can be used in any way you see fit with no restrictions.
If you see something that another member has posted, however, please check with them regarding their policy on sharing their work.
---
Scott Ferguson
To unsubscribe from this group and all its topics, send an email to app-inventor-developers-library+unsubscribe@googlegroups.com.
Esta Cervexa
Jul 1, 2015, 3:15:01 PM7/1/15
to app-inventor-de...@googlegroups.com
Hi Scott,
Thank you for quick reply.
Is there any way to remove such delay while fill?
Regards,
Jacek
To unsubscribe from this group and all its topics, send an email to app-inventor-develope...@googlegroups.com.
For more options, visit https://groups.google.com/d/optout.
--
(you have received this message from the App Inventor Developers Library)
---
You received this message because you are subscribed to a topic in the Google Groups "App Inventor Developers Library" group.
To unsubscribe from this topic, visit https://groups.google.com/d/topic/app-inventor-developers-library/NBuCEDP8SxQ/unsubscribe.
To unsubscribe from this group and all its topics, send an email to app-inventor-develope...@googlegroups.com.
Scott Ferguson
Jul 2, 2015, 5:43:58 PM7/2/15
to app-inventor-de...@googlegroups.com, estac...@gmail.com
The algorithm determines the speed of fill:
Buidl list of left and right points, sort points, then use DrawLine to fill.
If you can find or develop a faster algorithm then it may be possible or you may be able to tweak mine in some way.
But, keep in mind that App Inventor is not optimized for speed in graphics and animation so there will be a limit to what you can do.
---
Scott
To unsubscribe from this group and all its topics, send an email to app-inventor-developers-library+unsubscribe@googlegroups.com.
For more options, visit https://groups.google.com/d/optout.
--
(you have received this message from the App Inventor Developers Library)
---
You received this message because you are subscribed to a topic in the Google Groups "App Inventor Developers Library" group.
To unsubscribe from this topic, visit https://groups.google.com/d/topic/app-inventor-developers-library/NBuCEDP8SxQ/unsubscribe.
To unsubscribe from this group and all its topics, send an email to app-inventor-developers-library+unsubscribe@googlegroups.com.

Jhaman Khatri
Feb 1, 2017, 3:39:22 AM2/1/17
to App Inventor Developers Library
i need source code for this in android ? Regards
Michael Ferguson
Feb 9, 2017, 4:35:55 PM2/9/17
to App Inventor Developers Library
The source is the aia file attached to the top of this thread.
There is no JAVA source.
---
sf

Ryuu Yokomory
Oct 25, 2018, 10:28:53 AM10/25/18
to App Inventor Developers Library
I am trying to use your code from the files you have attached but, they are not working, I am trying to make a very complex painting app that I started from paint pot. The only code I can get is the pictures you posted. Can you please post the rest of the code on a picture instead?
Michael Ferguson
Oct 27, 2018, 6:11:03 PM10/27/18
to App Inventor Developers Library
Sorry. I no longer develop these apps. And when MIT updates their code, they often break the function of programs developed with older versions of their software. That is very frustrating.

Taifun
Oct 31, 2018, 6:25:42 PM10/31/18
to App Inventor Developers Library
the example app from the first post is working well, I just tried it
for faster screen switching you might want to first build the app and then test...
for faster screen switching you might want to first build the app and then test...
Taifun
Reply all
Reply to author
Forward
0 new messages