Plotting sin, cos, tan
1,133 views
Skip to first unread message

Scott Ferguson
Jul 26, 2014, 8:39:58 AM7/26/14
to app-inventor-de...@googlegroups.com
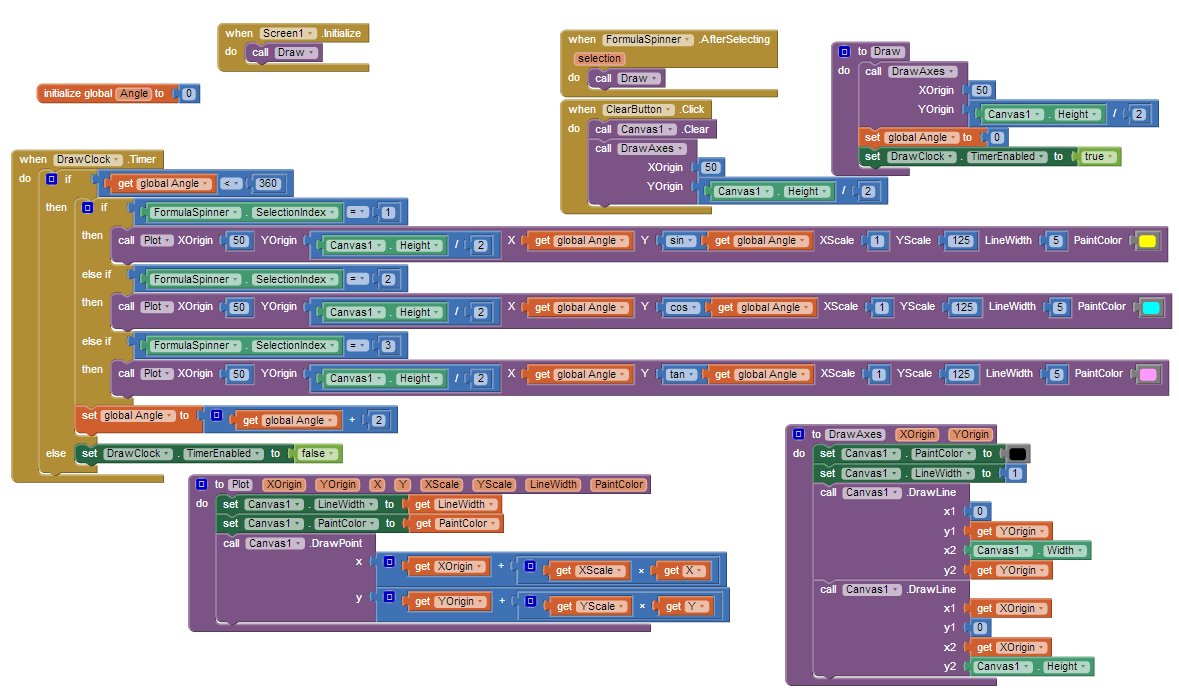
This project is based on the YouTube video Episode 2 of Coding Math (in javascript).
It plots graphs of the sine, cosine and tangent functions.
Note that since y increases from top to bottom on the AI Canvas, the graphs are 'upside down' when compared to the standard cartesian coordinate system.
To compensate for this you can put a minus sign in front of the trig functions.

---
sf
Reply all
Reply to author
Forward
0 new messages