Bars and candles both in one chart
15 views
Skip to first unread message

Евгений Храмов
Dec 19, 2017, 12:38:21 PM12/19/17
to Androidplot
Hi!
I have an app with some behavior
And I check this library if I can do chart like this
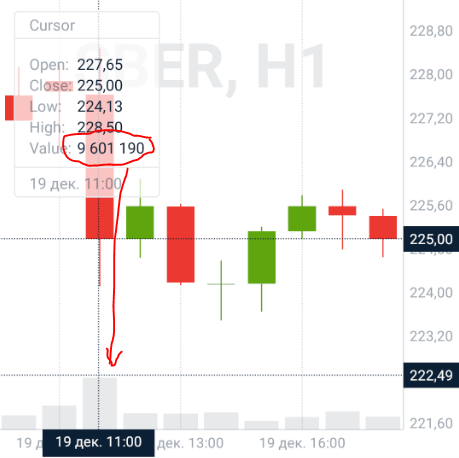
Let me explain screenshot
As you can see chart have 2 series
- candles with values close to ~225
- bars with values range from 0 to 9601190
Candle series autoscales verticaly
Bars series take only 1/3 of screen
I am created test app with "androidplot"
But I can't setup scale behavior like this (
How can I setup RangeBoundaries for candles and bars independently?
I have an app with some behavior
And I check this library if I can do chart like this
Let me explain screenshot
As you can see chart have 2 series
- candles with values close to ~225
- bars with values range from 0 to 9601190
Candle series autoscales verticaly
Bars series take only 1/3 of screen
I am created test app with "androidplot"
But I can't setup scale behavior like this (
How can I setup RangeBoundaries for candles and bars independently?

Nick
Dec 22, 2017, 8:04:47 AM12/22/17
to Androidplot
Yep it's possible. What you're wanting to do is use a dual scale for the two datasets. There's some documentation here. If you run into trouble or have additional technical questions feel free to ask on Stack Overflow as technical questions are no longer answered on this forum.
Good luck!
Good luck!
Reply all
Reply to author
Forward
0 new messages