Performance graph
13 views
Skip to first unread message

maxcode ITSolutions
May 29, 2023, 8:04:52 AM5/29/23
to adwor...@googlegroups.com
Hi,
I am trying to create a graph like below image using google ads api
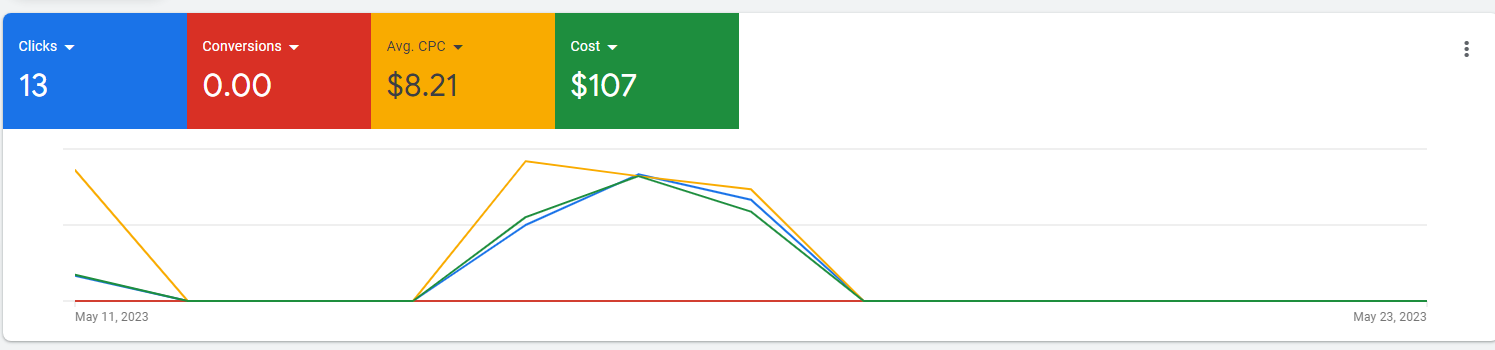
How to get data by day, weekly and monthly . I need data like this:
| Date | Clicks | Impressions | Avg. CPC | Cost |
| Thu, May 11, 2023 | 0 | 0 | $0.00 | $0.00 |
| Fri, May 12, 2023 | 0 | 0 | $0.00 | $0.00 |
| Sat, May 13, 2023 | 0 | 0 | $0.00 | $0.00 |
| Sun, May 14, 2023 | 0 | 0 | $0.00 | $0.00 |
| Mon, May 15, 2023 | 0 | 0 | $0.00 | $0.00 |
| Tue, May 16, 2023 | 0 | 0 | $0.00 | $0.00 |
| Wed, May 17, 2023 | 0 | 0 | $0.00 | $0.00 |
| Thu, May 18, 2023 | 0 | 0 | $0.00 | $0.00 |
| Fri, May 19, 2023 | 0 | 0 | $0.00 | $0.00 |
| Sat, May 20, 2023 | 0 | 0 | $0.00 | $0.00 |
| Sun, May 21, 2023 | 0 | 0 | $0.00 | $0.00 |
| Mon, May 22, 2023 | 0 | 0 | $0.00 | $0.00 |
| Tue, May 23, 2023 | 0 | 0 | $0.00 | $0.00 |

Google Ads API Forum Advisor
Jun 1, 2023, 3:31:21 AM6/1/23
to maxcodeit...@gmail.com, adwor...@googlegroups.com
Hello,
Thank you for reaching out to us.
With regard to your use case, you will need to use the following fields:

Thank you for reaching out to us.
With regard to your use case, you will need to use the following fields:
- segments.date
- metrics.clicks
- metrics.impressions
- metrics.average_cpc
- metrics.cost_micros
SELECT segments.date, metrics.clicks, metrics.impressions, metrics.average_cpc, metrics.cost_micros FROM customer WHERE segments.date BETWEEN '2023-05-01' AND '2023-05-31'
This message is in relation to case "ref:_00D1U1174p._5004Q2luKn5:ref"
Thanks,
Thanks,
 |
Google Ads API Team |
Reply all
Reply to author
Forward
0 new messages