Accessing MRI and PET images from the same patients?

Nat Tomov
I am trying to obtain a dataset of MRI and PET images from the same patients so that I can train an algorithm to learn from patients with MRI and PET scans and generate missing PET scans (for patients with MRI scans but no PET scans). My research seeks to elaborate on the project described in this paper: https://www.ncbi.nlm.nih.gov/pmc/articles/PMC4464771/
How do I do an ADNI database search that allows me to download both MRI and PET scans for the same patients?
From what I have tried, it seems that the pre-packaged study data is all MRI, and then searching the image collections turn up either MRI or PET images even though I know that there are at least 200 patients in this database with both.
What are the search terms I should use to find these patients with both MRI and PET scans?
Thank you.

Danielle J Harvey
Hi Nat,
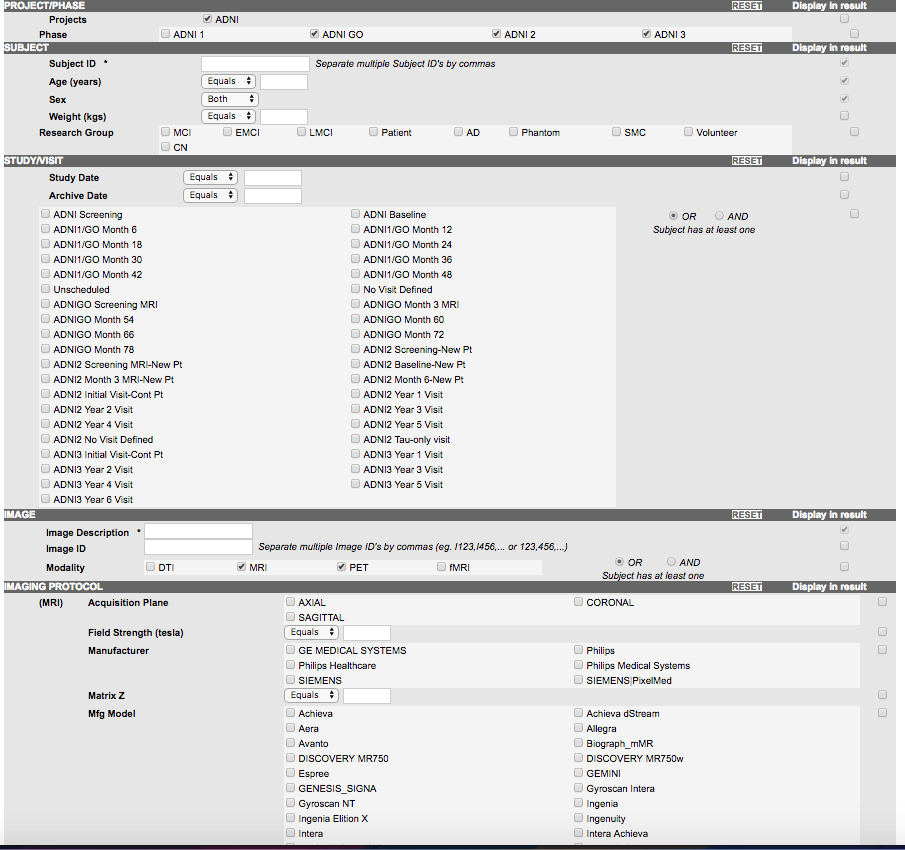
Have you tried clicking the boxes for MRI and PET under modality in the Advanced Search (the default radio button is OR). If you want individuals with both, switch the OR to AND. This seems to pull up participants that have both at at least one visit (though it also pulls up MRIs at visits where there is no PET).
It might help to restrict to ADNI-GO, ADNI-2 and ADNI-3, since all participants in those phases are getting PET, whereas only a subset in ADNI-1 received PET. Also, In ADNI-GO, ADNI-2, ADNI-3, the schedule for PET was every other year, so you could specify the visits in the search to include ADNI GO Screening MRI, ADNI Baseline, ADNI2 Screening MRI-New Pt, ADNI1/GO Month 24, ADNI2 Year 2 Visit, ADNI1/GO Month 48, ADNI2 Year 4 Visit, etc.
This will likely miss those from ADNI-1 who continued into ADNI-GO/2 who started getting PET in ADNI-GO/2 (but they also had MRI at 1.5T, while ADNI-GO/2 were scanned at 3T). So, you’ll have to decide how you want to handle that or if you are just going to work with 3T MRI and PET (in which case the ADNI-GO/2/3 should capture most of those…
Danielle
--
You received this message because you are subscribed to the Google Groups "Alzheimer's Disease Neuroimaging Initiative (ADNI) Data" group.
To unsubscribe from this group and stop receiving emails from it, send an email to
adni-data+...@googlegroups.com.
To post to this group, send email to
adni...@googlegroups.com.
Visit this group at https://groups.google.com/group/adni-data.
For more options, visit https://groups.google.com/d/optout.
Nat Tomov
Danielle J Harvey
Hi Nat,
My guess is that you want to use the MPRAGE (for one of the vendors, you will see IR-SPGR or IR-FSPGR in the sequence name). The MPRAGE SENSE2, MPRAGE GRAPPA2, Accelerated SAG IR-SPGR, Accelerated Sag IR_FSPGR are accelerated acquisitions (we obtained both
during ADNI-2).
Nat Tomov
Danielle J Harvey
Hi Nat,
You can access diagnostic information from the Study Data page on the LONI ADNI website (after you login, click on Download and then Study Data). The Diagnostic Summary file includes diagnosis information for all participants in ADNI at each visit (VISCODE2). The clinical data files use RID as the participant identifier, while the images are generally stored under PTID (in the format of XXX_S_RID). You can use the Roster file (available under the Enrollment section of the Study Data page to directly link PTID to RID). The Data Dictionary (under Study Info/Data & Databases section of the Study Data page) gives coding information for diagnosis. Alternatively, you can download the ADNIMERGE.csv (Key ADNI tables merged into one table, found under the Study Info/Data & Databases section of the Study Data page). This file has merged diagnosis information with a lot of additional variables at each visit for all participants of ADNI.
Nat Tomov
Danielle J Harvey
Hi Nat,
It really depends on what you are trying to do with the images. The image files are essentially 3-dimensional arrays of numbers corresponding to voxels (volume elements) in the image. There are a variety of software packages that read image files (SPM and FSL are examples). I believe there is also an R package that was written to read and analyze image files. There’s generally a decent amount of pre-processing that gets done to the images to be able to work with images across multiple people (to have them all in similar “space”, etc.)
If you aren’t all that familiar with image data, have you considered using summaries that others have already generated from the images (for example, from FreeSurfer, which includes volumes and cortical thickness for a fairly large number of regions in both the right and left hemisphere)? I’m assuming you are running some sort of machine learning algorithm, so having a large number of variables is important.

solmaz Vh

Naomi Saito
Sent: Tuesday, September 5, 2023 2:47 PM
solmaz Vh
Thank you for Your help . if I I have a bunch of ADNI PET datasets and want to write a script to separate them in 3 types(Amyloid, FDG,Tau) , I need some keywords for separating them. I found many of them but still there are many nii files that not sure about their type and don't want to check all of them one by one . do you have any solution to find right keywords that can sort all of my pet data in 3 types?