Single marker analysis with R/qtl

Ramesh Bhat
Can we do single marker analysis with R/qtl?
Please suggest the functions and scripts.
Kind regards,

Karl Broman
"marker regression".
Best to use method="em" or method="hk".
karl
Ramesh Bhat
Are the codes and sample data file available for single marker analysis?
Karl Broman
--
You received this message because you are subscribed to the Google Groups "R/qtl discussion" group.
To unsubscribe from this group and stop receiving emails from it, send an email to rqtl-disc+...@googlegroups.com.
To post to this group, send email to rqtl...@googlegroups.com.
Visit this group at https://groups.google.com/group/rqtl-disc.
For more options, visit https://groups.google.com/d/optout.
Ramesh Bhat
Karl Broman
library(qtl)
data(hyper)
ls()
We don't have a CSV file available, but you could write it to a file
with write.cross():
write.cross(hyper, "csv", "hyper")
this will create a file "hyper.csv" in your R working directory.
karl
> You received this message because you are subscribed to the Google
> Groups "R/qtl discussion" group.
> To unsubscribe from this group and stop receiving emails from it, send
> an email to rqtl-disc+...@googlegroups.com
Ramesh Bhat
On Friday, March 29, 2019 at 4:57:39 PM UTC+5:30, Ramesh Bhat wrote:
Ramesh Bhat
Karl Broman
Ramesh Bhat
-
out.hr <- scanone(sug, pheno.col=2:10, method="hk”)
Karl Broman
Dear Dr. Karl,
Here is a sample file with two traits (trait1 and trait2) and three markers (marker1, marker2 and marker3).Can you please provide me the codes for single marker analysis (trait1~marker1, trait1~marker2, trait1~marker3, trait2~marker1, trait2~marker2 and trait2~marker3)?Kind regards,
Ramesh Bhat
Karl Broman
Ramesh Bhat
Ramesh Bhat
Karl Broman
location in the genome, one at a time, as the possible QTL.
The genome scan can be performed by multiple methods.
In "single marker analysis", one would consider each marker one at a
time, but would have to omit any individuals that have missing genotype
at the marker.
An improvement on that is interval mapping (Lander and Botstein 1989),
which uses information at surrounding markers to essentially infer
genotype for the individuals with missing marker genotype. This method
also allows you to interrogate positions between markers.
For more details, see Chapter 4 of the R/qtl book
(http://rqtl.org/book), or this review:
https://www.biostat.wisc.edu/~kbroman/publications/labanimal.pdf
karl
On 4/7/19 8:38 AM, Ramesh Bhat wrote:
> How does scanone function varies from single marker analysis?
>
>
>
>> On 06-04-2019, at 6:27 PM, Karl Broman <kbr...@gmail.com
>>
>> You can use any encoding provided that you are consistent across all
>> markers. You indicate your genotype codes with the ‘genotype’
>> argument in read.cross().
>>
>> karl
>>
>> On Apr 5, 2019, at 9:12 PM, Ramesh Bhat <bhatra...@gmail.com
>>
>>> With respect to the sample data file “sug.csv”, should we mention
>>> CC, BB or CB? or can we give it as C, B or H?
>>>
>>>
>>>
>>>> On 03-04-2019, at 8:52 PM, Karl Broman <kbr...@gmail.com
>>>>
>>>> R/qtl is not the appropriate software for such data.
>>>>
>>>> karl
>>>>
>>>> On Apr 3, 2019, at 4:08 PM, Ramesh Bhat <bhatra...@gmail.com
>>>>
>>>>> Dear Dr. Karl,
>>>>>
>>>>> Here is a sample file with two traits (trait1 and trait2) and
>>>>> three markers (marker1, marker2 and marker3).
>>>>>
>>>>> Can you please provide me the codes for single marker analysis
>>>>> (trait1~marker1, trait1~marker2, trait1~marker3, trait2~marker1,
>>>>> trait2~marker2 and trait2~marker3)?
>>>>>
>>>>> Kind regards,
>>>>>
>>>>>> On 29-Mar-2019, at 9:11 PM, Karl Broman <kbr...@gmail.com
>>>>>>
>>>>>> You can analyze them individually or together. See page 5 of
>>>>>> http://rqtl.org/tutorials/rqtltour2.pdf
>>>>>>
>>>>>> karl
>>>>>>
>>>>>> On Mar 29, 2019, at 10:36 AM, Ramesh Bhat <bhatra...@gmail.com
>>>>>>
>>>>>>> How about single marker analysis for many traits? Should we do
>>>>>>> it separately or can we do it with reiteration?
>>>>>>>
>>>>>>> May I know the codes?
>>>>>>>
>>>>>>>
>>>>>>>
>>>>>>>> On 29-Mar-2019, at 5:43 PM, Karl Broman <kbr...@gmail.com
>>>>>>>>
>>>>>>>> The data file would be the same; sample data files at
>>>>>>>> http://rqtl.org/sampledata
>>>>>>>>
>>>>>>>> Marker discussion is discussed at the beginning of chapter 4 of
>>>>>>>> the R/qtl book, http://rqtl.org/book/
>>>>>>>>
>>>>>>>> It’s not discussed in the tutorials
>>>>>>>> (http://rqtl.org/tutorials), because I strongly recommend
>>>>>>>> against it.
>>>>>>>>
>>>>>>>> karl
>>>>>>>>
>>>>>>>> On Mar 29, 2019, at 7:08 AM, Ramesh Bhat
>>>>>>>>
>>>>>>>>> On Friday, March 29, 2019 at 5:04:40 PM UTC+5:30, Karl Broman
>>>>>>>>> wrote:
>>>>>>>>>> It is not recommended, but you can use scanone() with
>>>>>>>>>> method="mr" for
>>>>>>>>>> "marker regression".
>>>>>>>>>> Best to use method="em" or method="hk".
>>>>>>>>>>
>>>>>>>>>> karl
>>>>>>>>>>
>>>>>>>>>> On 3/29/19 6:27 AM, Ramesh Bhat wrote:
>>>>>>>>>>> Hi,
>>>>>>>>>>>
>>>>>>>>>>> Can we do single marker analysis with R/qtl?
>>>>>>>>>>>
>>>>>>>>>>> Please suggest the functions and scripts.
>>>>>>>>>>>
>>>>>>>>>>> Kind regards,
>>>>>>>>>>>
>>>>>>>>>
>>>>>>>>> Are the codes and sample data file available for single marker
>>>>>>>>> analysis?
>>>>>>>>>
>>>>>>>>> --
>>>>>>>>> You received this message because you are subscribed to the
>>>>>>>>> Google Groups "R/qtl discussion" group.
>>>>>>>>> To unsubscribe from this group and stop receiving emails from
>>>>>>>>> it, send an email to rqtl-disc+...@googlegroups.com
>>>>>>>>> For more options, visit https://groups.google.com/d/optout.
>>>>>>>>
>>>>>>>> --
>>>>>>>> You received this message because you are subscribed to the
>>>>>>>> Google Groups "R/qtl discussion" group.
>>>>>>>> To unsubscribe from this group and stop receiving emails from
>>>>>>>> it, send an email to rqtl-disc+...@googlegroups.com
>>>>>>>> For more options, visit https://groups.google.com/d/optout.
>>>>>>>
>>>>>>>
>>>>>>> --
>>>>>>> You received this message because you are subscribed to the
>>>>>>> Google Groups "R/qtl discussion" group.
>>>>>>> To unsubscribe from this group and stop receiving emails from
>>>>>>> it, send an email to rqtl-disc+...@googlegroups.com
>>>>>>> For more options, visit https://groups.google.com/d/optout.
>>>>>>
>>>>>> --
>>>>>> You received this message because you are subscribed to the
>>>>>> Google Groups "R/qtl discussion" group.
>>>>>> To unsubscribe from this group and stop receiving emails from it,
>>>>>> send an email to rqtl-disc+...@googlegroups.com
>>>>>> For more options, visit https://groups.google.com/d/optout.
>>>>>
>>>>>
>>>>> --
>>>>> You received this message because you are subscribed to the Google
>>>>> Groups "R/qtl discussion" group.
>>>>> To unsubscribe from this group and stop receiving emails from it,
>>>>> send an email to rqtl-disc+...@googlegroups.com
>>>>> For more options, visit https://groups.google.com/d/optout.
>>>>
>>>> --
>>>> You received this message because you are subscribed to the Google
>>>> Groups "R/qtl discussion" group.
>>>> To unsubscribe from this group and stop receiving emails from it,
>>>> send an email to rqtl-disc+...@googlegroups.com
>>>> For more options, visit https://groups.google.com/d/optout.
>>>
>>>
>>> --
>>> You received this message because you are subscribed to the Google
>>> Groups "R/qtl discussion" group.
>>> To unsubscribe from this group and stop receiving emails from it,
>>> send an email to rqtl-disc+...@googlegroups.com
>>> For more options, visit https://groups.google.com/d/optout.
>>
>> --
>> You received this message because you are subscribed to the Google
>> Groups "R/qtl discussion" group.
>> To unsubscribe from this group and stop receiving emails from it,
>> send an email to rqtl-disc+...@googlegroups.com
>> For more options, visit https://groups.google.com/d/optout.
>
> --
> You received this message because you are subscribed to the Google
> Groups "R/qtl discussion" group.
> To unsubscribe from this group and stop receiving emails from it, send
> an email to rqtl-disc+...@googlegroups.com
Ramesh Bhat
Dear Dr. Broman,
Can I expect an improvement in R/qtl for
1. Better quality of the figure for genetic map
2. Exporting the map order of the markers on the chromosome to a csv or txt file.
Bhat
To unsubscribe from this group and stop receiving emails from it, send an email to rqtl-disc+...@googlegroups.com.
To post to this group, send email to rqtl...@googlegroups.com.
Karl Broman
On Wednesday, April 10, 2019 at 10:11:13 AM UTC-5, Ramesh Bhat wrote:
Can I expect an improvement in R/qtl for1. Better quality of the figure for genetic map
2. Exporting the map order of the markers on the chromosome to a csv or txt file.
Ramesh Bhat
Ramesh Bhat
Ramesh Bhat
Karl Broman
On 4/10/19 10:39 AM, Ramesh Bhat wrote:
>
> Sorry to know that you are not planning to improve the map. Any other
> clear alternative method do you suggest?
>
https://cran.r-project.org/package=LinkageMapView
> Can you please provide me some more details on the use of pull.map()
> and map2table() to get the genetic map as a data frame?
map <- pull.map(hyper)
map_as_table <- map2table(map)
>
> Is the write.csv() for pull.map and map2table?
>
>
write.csv(map_as_table, "map.csv")
write.table() is a bit more flexible.
write.table(map_as_table, "map.csv", row.names=TRUE,
col.names=TRUE, sep=",", quote=FALSE)
karl
Ramesh Bhat
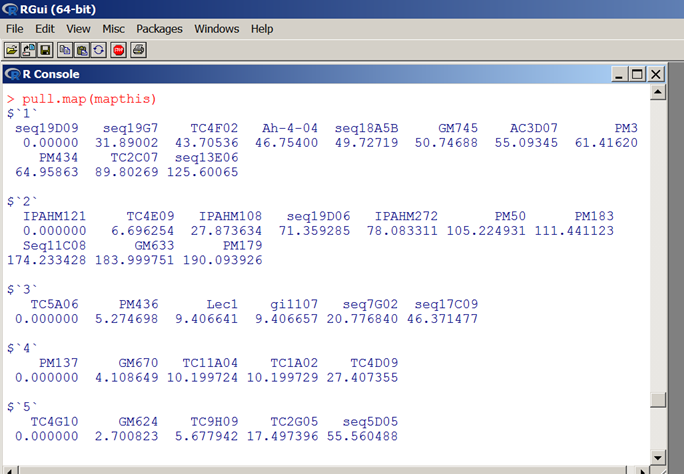
data(mapthis)
map <- pull.map(mapthis, chr=5)
map_as_table <- map2table(map)
write.csv(map_as_table, "map.csv")
--
You received this message because you are subscribed to the Google Groups "R/qtl discussion" group.
To unsubscribe from this group and stop receiving emails from it, send an email to rqtl-disc+...@googlegroups.com.
To post to this group, send email to rqtl...@googlegroups.com.
Visit this group at https://groups.google.com/group/rqtl-disc.
For more options, visit https://groups.google.com/d/optout.
Department of Biotechnology
University of Agricultural Sciences, Dharwad
PIN: 580 005, Dharwad, Karnataka, India
Ph: +91-836-2214457, Mobile: +91-9945667300
Ramesh Bhat
Dear Karl,I have the following questions.1. Does "summary(rip5lik)” show only the best order?
LOD chrlen
Initial 1 2 3 4 5 6 7 8 9 0.0 38.2
1 1 2 3 4 5 6 7 9 8 0.1 38.4 2. How to get the list of unmapped markers?3. If window is equal to the number of markers on the chromosome, how to indicate in the following script rip5 <- ripple(mapthis, chr=5, window=7)4. Reduced assumed genotyping error rate lead to increased map length: Is it always so, why?5. Can I see all the orders insummary(rip5) obligXO
Initial 1 2 3 4 5 6 7 8 9 215
1 1 2 3 4 5 6 7 9 8 216
2 1 2 3 4 6 5 7 8 9 2176. Can I see a particular order (say order number 101), and is the order 1 the best among the 18000 in terms of obligXO inrip4 <- ripple(mapthis, chr=4, window=7) 18000 total orders > summary(rip4) obligXO Initial 1 2 3 4 5 6 7 8 9 10 326 1 1 2 3 4 5 6 7 8 10 9 326Bhat
Ramesh Bhat
plot.pxg(hyper, "D4Mit214")
plot.pxg(hyper, "D12Mit20")
Karl Broman
Karl Broman
<Map construction.docx>
Karl Broman
1. Does "summary(rip5lik)” show only the best order?
                                        LOD chrlen
Initial  1 2 3 4 5 6 7 8 9     0.0   38.2
1        1 2 3 4 5 6 7 9 8     0.1   38.4
2. How to get the list of unmapped markers?
3. If window is equal to the number of markers on the chromosome, how to indicate in the following scriptrip5 <- ripple(mapthis, chr=5, window=7)
4. Reduced assumed genotyping error rate lead to increased map length: Is it always so, why?
5. Can I see all the orders insummary(rip5)obligXO Initial 1 2 3 4 5 6 7 8 9 215 1 1 2 3 4 5 6 7 9 8 216 2 1 2 3 4 6 5 7 8 9 217
6. Can I see a particular order (say order number 101), and is the order 1 the best among the 18000 in terms of obligXO inrip4 <- ripple(mapthis, chr=4, window=7) 18000 total orders > summary(rip4) obligXO Initial 1 2 3 4 5 6 7 8 9 10 326 1 1 2 3 4 5 6 7 8 10 9 326
Ramesh Bhat
How to get the list of unmapped markers?
I’m not sure what you mean.
If there are 100 markers for mapping, say only 90 are mapped on the chromosomes. We say 10 are unmapped. Ex; C5M2 not mapped on chr 5 in “Mapthis”. Can we get a list of makers which are not mapped on any of the chromosomes?
If window is equal to the number of markers on the chromosome, how to indicate in the following script
rip5 <- ripple(mapthis, chr=5, window=7)
I’m not sure what you mean.
I do not want a window size of 7, instead I want all the markers on chr 5 for ripple. What change is to be made in the above script? Why do we fix a window size?
Bhat
Karl Broman
How to get the list of unmapped markers?
I’m not sure what you mean.
If there are 100 markers for mapping, say only 90 are mapped on the chromosomes. We say 10 are unmapped. Ex; C5M2 not mapped on chr 5 in “Mapthis”. Can we get a list of makers which are not mapped on any of the chromosomes?
If window is equal to the number of markers on the chromosome, how to indicate in the following script
rip5 <- ripple(mapthis, chr=5, window=7)
I’m not sure what you mean.
I do not want a window size of 7, instead I want all the markers on chr 5 for ripple. What change is to be made in the above script? Why do we fix a window size?
karl
Ramesh Bhat
--
You received this message because you are subscribed to a topic in the Google Groups "R/qtl discussion" group.
To unsubscribe from this topic, visit https://groups.google.com/d/topic/rqtl-disc/ZPwcHhO0T6Q/unsubscribe.
To unsubscribe from this group and all its topics, send an email to rqtl-disc+...@googlegroups.com.
Karl Broman
karl
You received this message because you are subscribed to the Google Groups "R/qtl discussion" group.
To unsubscribe from this group and stop receiving emails from it, send an email to rqtl-disc+...@googlegroups.com.
Ramesh Bhat
Karl Broman
Within R, type
?movemarker
karl
Ramesh Bhat
Karl Broman
karl
Ramesh Bhat
Ramesh Bhat
library(qtl)
hyper<-read.cross("csv", file="hyperm.csv", crosstype="bc", genotypes=c(“AA”,”BB”, "AB"))
par(mfrow=c(1,2))
plotPXG(hyper, "D4Mit214")
plotPXG(hyper, "D12Mit20")
out.mr <- scanone(hyper, method="mr")
summary(out.mr, threshold=3)
max(out.mr)
plot(out.mr, chr=c(4, 12), ylab="LOD score")
But I get the following errors
summary(out.mr, threshold=3)
There were no LOD peaks above the threshold.
max(out.mr)
There were no LOD peaks above the threshold.
Kindly help me.
Ramesh Bhat
mapthis <- subset(mapthis, ind=(ntyped(mapthis)>50))
todrop <- names(nt.bymar[nt.bymar < 200])
hist(cg[lower.tri(cg)], breaks=seq(0, 1, len=101), xlab="No. matching genotypes")
plot(dropone, lod=1, ylim=c(-100,0))
mapthis <- subset(mapthis, ind=(countXO(mapthis) < 50))
Should I change for my data?
Karl Broman
On 4/11/19 10:10 AM, Ramesh Bhat wrote:
> Specifying a position on a new chromosome while moving a marker is
> possible if we know it.
>
> Unless, we move, we will not know the position. Am I right?
arbitrary order, and then try to figure out the order.
>
> In scanone, can we get the significance and effect for a marker?
>
> In scanone, does the position of a marker influence the significance,
> LOd and effect?
>
>
n.perm specified.
To get estimated effects at markers, you need to use makeqtl() and fitqtl().
The positions of the markers are extremely important.
karl
Karl Broman
lot of missing genotype information.
karl
On 4/11/19 11:53 PM, Ramesh Bhat wrote:
> Dear Karl,
>
> Following are the scripts for Single-QTL analysis. The only change I
> made is to call the "hyper" file from my working directory. "hyperm"
> is identical to "hyper"
>
> library(qtl)
>
> hyper<-read.cross("csv", file="hyperm.csv", crosstype="bc",
> genotypes=c(“AA”,”BB”, "AB"))
>
> par(mfrow=c(1,2))
>
> plotPXG(hyper, "D4Mit214")
>
> plotPXG(hyper, "D12Mit20")
>
>
> out.mr <http://out.mr>[ out.mr <http://out.mr>$chr == 12, ]
>
> summary(out.mr <http://out.mr>, threshold=3)
>
> max(out.mr <http://out.mr>)
>
> plot(out.mr <http://out.mr>, chr=c(4, 12), ylab="LOD score")
>
> But I get the following errors
>
> There were no LOD peaks above the threshold.
>
>
> There were no LOD peaks above the threshold.
>
>
> Kindly help me.
>
>
>
> On Thu, Apr 11, 2019 at 8:28 PM Karl Broman <kbr...@gmail.com
> <mailto:kbr...@gmail.com>> wrote:
>
> you can specify the position to which you want to move it, or you
> can just have it placed some arbitrary distance off the end.
>
> karl
>
> On 4/11/19 9:47 AM, Ramesh Bhat wrote:
>> Can we know the position of the marker to be moved to a new chr?
>> Otherwise, it will be placed at the end of the chromosome.
>>
>> Sent from my iPad
>>
>> On 11-Apr-2019, at 7:44 PM, Karl Broman <kbr...@gmail.com
>>
>>> Every function has a help file which includes examples.
>>> Within R, type
>>>
>>> ?movemarker
>>>
>>> karl
>>>
>>> On 4/11/19 9:13 AM, Ramesh Bhat wrote:
>>>> Sorry, any example of movemarker()?
>>>> Say moving C5M2 to chro 4 (from chr 5).
>>>>
>>>>
>>>>
>>>>
>>>>
>>>> Sent from my iPad
>>>>
>>>> On 11-Apr-2019, at 7:24 PM, Karl Broman <kbr...@gmail.com
>>>>
>>>>> You can use movemarker()
>>>>>
>>>>> karl
>>>>>
>>>>> On 4/11/19 8:52 AM, Ramesh Bhat wrote:
>>>>>> If there are several hundreds of markers, and many are
>>>>>> unmapped, how to put them on the last chromosome?
>>>>>>
>>>>>>
>>>>>> Sent from my iPad
>>>>>>
>>>>>> On 11-Apr-2019, at 7:06 PM, Karl Broman <kbr...@gmail.com
>>>>>>> For more options, visit https://groups.google.com/d/optout.
>>>>>> --
>>>>>> You received this message because you are subscribed to the
>>>>>> Google Groups "R/qtl discussion" group.
>>>>>> To unsubscribe from this group and stop receiving emails from
>>>>>> it, send an email to rqtl-disc+...@googlegroups.com
>>>>>> For more options, visit https://groups.google.com/d/optout.
>>>>>
>>>>> --
>>>>> You received this message because you are subscribed to the
>>>>> Google Groups "R/qtl discussion" group.
>>>>> To unsubscribe from this group and stop receiving emails from
>>>>> it, send an email to rqtl-disc+...@googlegroups.com
>>>>> For more options, visit https://groups.google.com/d/optout.
>>>> --
>>>> You received this message because you are subscribed to the
>>>> Google Groups "R/qtl discussion" group.
>>>> To unsubscribe from this group and stop receiving emails from
>>>> it, send an email to rqtl-disc+...@googlegroups.com
>>>> For more options, visit https://groups.google.com/d/optout.
>>>
>>> --
>>> You received this message because you are subscribed to the
>>> Google Groups "R/qtl discussion" group.
>>> To unsubscribe from this group and stop receiving emails from
>>> it, send an email to rqtl-disc+...@googlegroups.com
>>> For more options, visit https://groups.google.com/d/optout.
>> --
>> You received this message because you are subscribed to the
>> Google Groups "R/qtl discussion" group.
>> To unsubscribe from this group and stop receiving emails from it,
>> send an email to rqtl-disc+...@googlegroups.com
>> For more options, visit https://groups.google.com/d/optout.
>
> --
> You received this message because you are subscribed to the Google
> Groups "R/qtl discussion" group.
> To unsubscribe from this group and stop receiving emails from it,
> send an email to rqtl-disc+...@googlegroups.com
> For more options, visit https://groups.google.com/d/optout.
>
>
>
> --
> Ramesh S. Bhat
> Professor and Head
> Department of Biotechnology
> University of Agricultural Sciences, Dharwad
> PIN: 580 005, Dharwad, Karnataka, India
> Ph: +91-836-2214457, Mobile: +91-9945667300
> --
> You received this message because you are subscribed to the Google
> Groups "R/qtl discussion" group.
> To unsubscribe from this group and stop receiving emails from it, send
> an email to rqtl-disc+...@googlegroups.com
Karl Broman
On 4/12/19 4:18 AM, Ramesh Bhat wrote:
> I am attempting map construction with my own data.
>
> What do the numbers (marked red) in the following scripts mean?
>
> mapthis <- subset(mapthis, ind=(ntyped(mapthis)>50))
>
> todrop <- names(nt.bymar[nt.bymar < 200])
>
> hist(cg[lower.tri(cg)], breaks=seq(0, 1, len=101), xlab="No. matching
> genotypes")
>
> plot(dropone, lod=1, ylim=c(-100,0))
>
cutoff for the y-axis limit
> mapthis <- subset(mapthis, ind=(countXO(mapthis) < 50))
>
>
> Should I change for my data?
>
>
karl
Ramesh Bhat
Which one one do you suggest instead of “mr"?
> To post to this group, send email to rqtl...@googlegroups.com.
Ramesh Bhat
> To post to this group, send email to rqtl...@googlegroups.com.
Ramesh Bhat
Please help.
> To post to this group, send email to rqtl...@googlegroups.com.
Ramesh Bhat
--
You received this message because you are subscribed to the Google Groups "R/qtl discussion" group.
To unsubscribe from this group and stop receiving emails from it, send an email to rqtl-disc+...@googlegroups.com.
To post to this group, send email to rqtl...@googlegroups.com.
Visit this group at https://groups.google.com/group/rqtl-disc.
For more options, visit https://groups.google.com/d/optout.
Karl Broman
karl
Karl Broman
Ramesh Bhat
Karl Broman
karl
> On Apr 12, 2019, at 6:59 AM, Ramesh Bhat <bhatra...@gmail.com> wrote:
>
> “hyper” file which was used from my working directory is here.
>
> You received this message because you are subscribed to the Google Groups "R/qtl discussion" group.
> To unsubscribe from this group and stop receiving emails from it, send an email to rqtl-disc+...@googlegroups.com.
> To post to this group, send email to rqtl...@googlegroups.com.
> Visit this group at https://groups.google.com/group/rqtl-disc.
> For more options, visit https://groups.google.com/d/optout.
Ramesh Bhat
Ramesh Bhat
Ramesh Bhat
Ramesh Bhat
Karl Broman
karl
Ramesh Bhat
pull.map(mapthis)
Ramesh Bhat
--
You received this message because you are subscribed to the Google Groups "R/qtl discussion" group.
To unsubscribe from this group and stop receiving emails from it, send an email to rqtl-disc+...@googlegroups.com.
To post to this group, send email to rqtl...@googlegroups.com.
Visit this group at https://groups.google.com/group/rqtl-disc.
For more options, visit https://groups.google.com/d/optout.
Karl Broman
Karl Broman
Ramesh Bhat
Ramesh Bhat
Ramesh Bhat
Karl Broman
Ramesh Bhat
Karl Broman
So, if the chromosome has 8 markers, with window=7 ripple() looks at a total of 9,360 marker orders. If there are say 11 markers, it looks at 22,320 orders, and if there are 20 markers, it looks at 61,200 orders. (I determined these numbers by trying it out with the hyper data.)
data(hyper)
nmar(hyper)
# 1 2 3 4 5 6 7 8 9 10 11 12 13 14 15 16 17 18 19 X
# 22 8 6 20 14 11 7 6 5 5 14 5 5 5 11 6 12 4 4 4
rip2 <- ripple(hyper, chr=2, window=7)
# 9360 total orders
rip7 <- ripple(hyper, chr=6, window=7)
# 22320 total orders
rip4 <- ripple(hyper, chr=4, window=7)
# 61200 total orders
karl
Ramesh Bhat
Ramesh Bhat
The manual says “By default in scanone, we consider the first phenotype in the input cross object. Other phenotypes, include the parallel consideration of multiple phenotypes, can be considered via the argument pheno.col.”
If my input file has phenotypes in the first 10 columns, can I go directly for
out.all <- scanone(sug, pheno.col=1:10, method="hk")
instead of
out.em <- scanone(sug)
Ramesh Bhat
plot(sug)
gives the following plots in a single Quartz window, like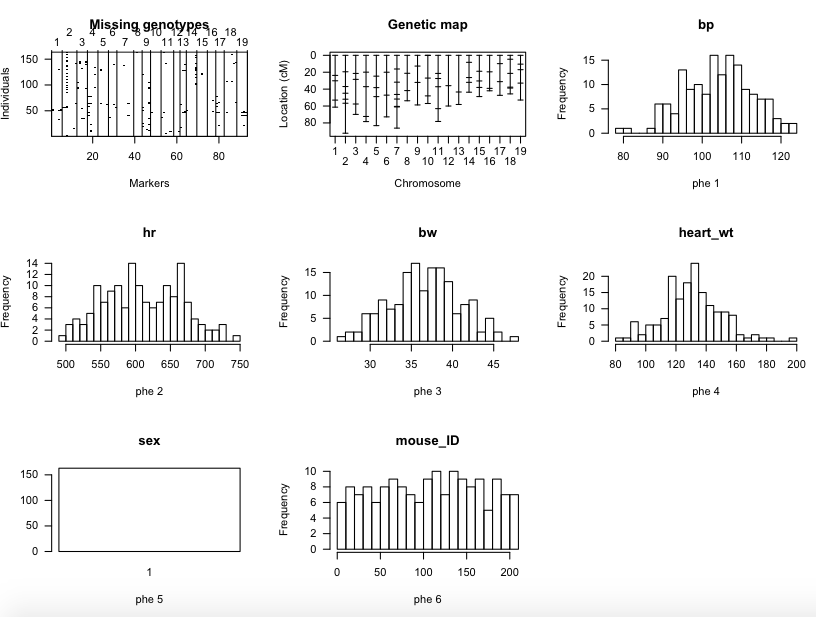
Ramesh Bhat
library(qtl)
sug <- read.cross("csv", "http://www.rqtl.org", "sug.csv",
genotypes=c("CC", "CB", "BB"), alleles=c("C", "B"))
sug <- calc.genoprob(sug, step=1)
out.all <- scanone(sug, pheno.col=1:4, method="hk")
summary(out.all, threshold=3, format="tabByCol")
summary(out.all, threshold=3, format="tabByChr”)
But I do not know whether it is the right way or not! Kindly suggest.
Begin forwarded message:
Karl Broman
karl
> On Apr 15, 2019, at 7:00 AM, Ramesh Bhat <bhatra...@gmail.com> wrote:
>
> plot(sug)
>
> gives the following plots in a single Quartz window, like
Ramesh Bhat
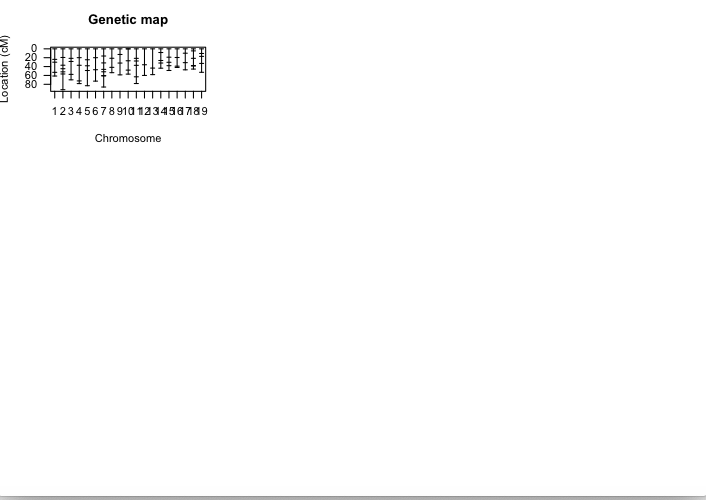
Karl Broman
par(mfrow=c(1,1)) # to reset to a single large plot
plotMap(sug)
> On Apr 15, 2019, at 9:59 AM, Ramesh Bhat <bhatra...@gmail.com> wrote:
>
> I got only the map now, but the sizer remains the same. Big window, but small picture!
>
Ramesh Bhat
Can we get the marker name on this plot?
Ramesh Bhat
1. This is relating to QTL effect (page # 122 in your book).
For a RIL population, where we have only two genotypes, we calculate only additive effect as (mean of BB - mean of AA)/2. So the positive value would indicate superiority of BB individuals over AA individuals. Am I correct?
off<-effectplot(hyper, mname=“D4Mit164”, draw=FALSE)
would give the effect for only D4Mit164. If I want the additive effect for all the QTL, then which code should I use?
2. This is relating to the phenotypic variance explained by the QTL (heritability due to QTL) (page # 122 in your book).
Can I know the code for calculating the phenotypic variance explained (heritability) for all the QTL with LOD more than a set value, say 3? Also, how can I get residual variance?
3. Can I get a QTL map (genetic map with significant QTL) for the traits?
Kind regards,
Karl Broman
> 1. This is relating to QTL effect (page # 122 in your book).
> For a RIL population, where we have only two genotypes, we calculate only additive effect as (mean of BB - mean of AA)/2. So the positive value would indicate superiority of BB individuals over AA individuals. Am I correct?
>
> off<-effectplot(hyper, mname=“D4Mit164”, draw=FALSE)
>
> would give the effect for only D4Mit164. If I want the additive effect for all the QTL, then which code should I use?
>
>
> 2. This is relating to the phenotypic variance explained by the QTL (heritability due to QTL) (page # 122 in your book).
>
> Can I know the code for calculating the phenotypic variance explained (heritability) for all the QTL with LOD more than a set value, say 3?
h^2 = 1 - 10^{- 2 LOD / n}
You can use that to determine the heritability that would correspond to LOD = 3.
> Also, how can I get residual variance?
>
> 3. Can I get a QTL map (genetic map with significant QTL) for the traits?
>
data(fake.f2)
fake.f2 <- calc.genoprob(fake.f2, step=1)
out <- scanone(fake.f2, method="hk")
operm <- scanone(fake.f2, method="hk", n.perm=1000, perm.Xsp=TRUE)
out_summary <- summary(out, perms=operm, alpha=0.05)
qtl <- makeqtl(fake.f2, chr=out_summary$chr, pos=out_summary$pos, what="prob")
plot(qtl)
karl
Ramesh Bhat
2. This is relating to the phenotypic
variance explained by the QTL (heritability due to QTL) (page # 122 in your
book).
Can I know the code for calculating the phenotypic variance explained
(heritability) for all the QTL with LOD more than a set value, say 3?
The relationship between the LOD score and the percent variance explained is
shown in the last full paragraph on page 77.
h^2 = 1 - 10^{- 2 LOD / n}
You can use that to determine the heritability that would correspond to LOD =
3.
This means, for a population of n samples, two or more QTL with same LOD will have same PVE/estimated heritability. Am I correct?
Can that happen?
Karl Broman
> On Apr 18, 2019, at 10:23 AM, Ramesh Bhat <bhatra...@gmail.com> wrote:
>
> 2. This is relating to the phenotypic variance explained by the QTL (heritability due to QTL) (page # 122 in your book).
>
> Can I know the code for calculating the phenotypic variance explained (heritability) for all the QTL with LOD more than a set value, say 3?
>
>
> The relationship between the LOD score and the percent variance explained is shown in the last full paragraph on page 77.
>
> h^2 = 1 - 10^{- 2 LOD / n}
>
> You can use that to determine the heritability that would correspond to LOD = 3.
>
>
> This means, for a population of n samples, two or more QTL with same LOD will have same PVE/estimated heritability. Am I correct?
>
> Can that happen?
>
So yeah, for a given sample size, if two QTL show the same LOD score, the estimated heritability will also be the same.
karl
Ramesh Bhat
LOD of 3, 2 or 1, with n=100, would give 100% heritability.
Not able to understand!
Karl Broman
On 4/18/19 10:52 AM, Ramesh Bhat wrote:
> LOD indicates only the strength of QTL detection, but PVE indicates the extent of the influence of that QTL on phenotype, Is this statement correct?
> LOD of 3, 2 or 1, with n=100, would give 100% heritability.
>
> Not able to understand!
>
>
>
n=100 and LOD=2 would give h^2 = 1 - 10^(-4/100) = 0.088
n=100 and LOD=3 would give h^2 = 1 - 10^(-6/100) = 0.129
karl
Ramesh Bhat
Ramesh Bhat
I shall also check.
Kind regards,
Ramesh Bhat
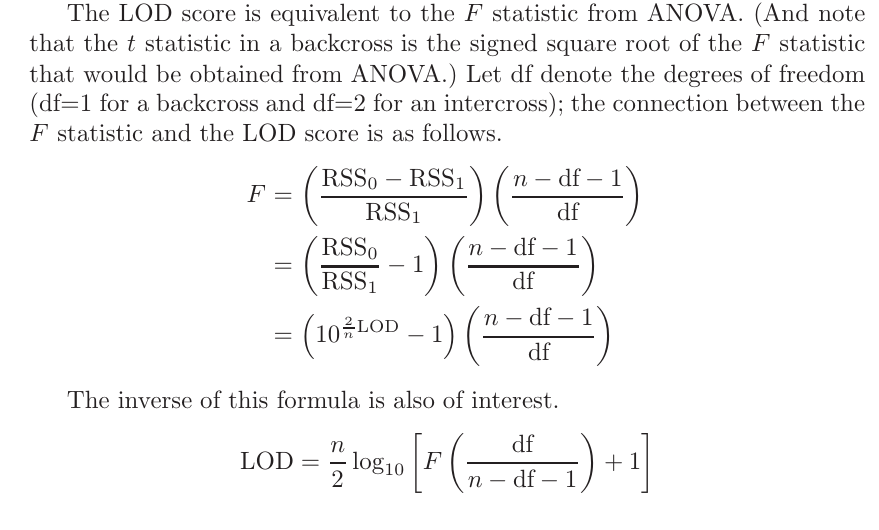
LOD = F statistic for a regression = F statistic from the ANOVA for an intercross
Ramesh Bhat
--
You received this message because you are subscribed to the Google Groups "R/qtl discussion" group.
To unsubscribe from this group and stop receiving emails from it, send an email to rqtl-disc+...@googlegroups.com.
To post to this group, send email to rqtl...@googlegroups.com.
Visit this group at https://groups.google.com/group/rqtl-disc.
For more options, visit https://groups.google.com/d/optout.
Karl Broman
Ramesh Bhat
Karl Broman
> On Apr 18, 2019, at 11:24 PM, Ramesh Bhat wrote:
>
> So, we can calculate LOD using F statistic, and we can calculate estimated heritability (PVE) using LOD.
Ramesh Bhat
Ramesh Bhat
--
You received this message because you are subscribed to the Google Groups "R/qtl discussion" group.
To unsubscribe from this group and stop receiving emails from it, send an email to rqtl-disc+...@googlegroups.com.
To post to this group, send email to rqtl...@googlegroups.com.
Visit this group at https://groups.google.com/group/rqtl-disc.
For more options, visit https://groups.google.com/d/optout.
Karl Broman
Can we get the result shown below as the csv file (attached) with single digits of map distance?
<image.png>
On Fri, Apr 19, 2019 at 9:53 PM Karl Broman <kbr...@gmail.com> wrote:
> On Apr 18, 2019, at 11:24 PM, Ramesh Bhat wrote:
>
> So, we can calculate LOD using F statistic, and we can calculate estimated heritability (PVE) using LOD.
yes
--
You received this message because you are subscribed to the Google Groups "R/qtl discussion" group.
To unsubscribe from this group and stop receiving emails from it, send an email to rqtl-disc+...@googlegroups.com.
To post to this group, send email to rqtl...@googlegroups.com.
Visit this group at https://groups.google.com/group/rqtl-disc.
For more options, visit https://groups.google.com/d/optout.
----Ramesh S. BhatProfessor and Head
Department of Biotechnology
University of Agricultural Sciences, Dharwad
PIN: 580 005, Dharwad, Karnataka, India
Ph: +91-836-2214457, Mobile: +91-9945667300
You received this message because you are subscribed to the Google Groups "R/qtl discussion" group.
To unsubscribe from this group and stop receiving emails from it, send an email to rqtl-disc+...@googlegroups.com.
To post to this group, send email to rqtl...@googlegroups.com.
Visit this group at https://groups.google.com/group/rqtl-disc.
To view this discussion on the web visit https://groups.google.com/d/msgid/rqtl-disc/CAK9gDVUEk3q8jsc0qbZ%3DKjwSPK5cjppAsVjDuTLi3PdjDELbFQ%40mail.gmail.com.
<Map.csv>
Ramesh Bhat
To view this discussion on the web visit https://groups.google.com/d/msgid/rqtl-disc/A8EE0AEE-849F-4E30-8EB4-E139B5D27A6F%40gmail.com.
For more options, visit https://groups.google.com/d/optout.
Karl Broman
To view this discussion on the web visit https://groups.google.com/d/msgid/rqtl-disc/CAK9gDVVDA8Jritw%3DMfDJNF_bKNmATDLVsW8MvAuEEiFw_xsTGg%40mail.gmail.com.
Ramesh Bhat
To view this discussion on the web visit https://groups.google.com/d/msgid/rqtl-disc/96397CD8-C5D2-41A0-92B4-6F57E1C945FE%40gmail.com.
For more options, visit https://groups.google.com/d/optout.
Karl Broman
To view this discussion on the web visit https://groups.google.com/d/msgid/rqtl-disc/CAK9gDVWta5CkA86ndX2ZUiEiNPOs7DNP0eC989ysfLHtELE_Rg%40mail.gmail.com.
Ramesh Bhat
write.csv(map, "Nmap.csv")
But got the following error
Error in as.data.frame.default(x[[i]], optional = TRUE, stringsAsFactors = stringsAsFactors) : cannot coerce class ‘"map"’ to a data.frame
If the chromosome number and the map positions can directly go to two rows of a csv file (file attached in my first email today), we save a lot of time.
To view this discussion on the web visit https://groups.google.com/d/msgid/rqtl-disc/6A613372-234A-420D-9013-70044B6747AE%40gmail.com.
For more options, visit https://groups.google.com/d/optout.
Ramesh Bhat
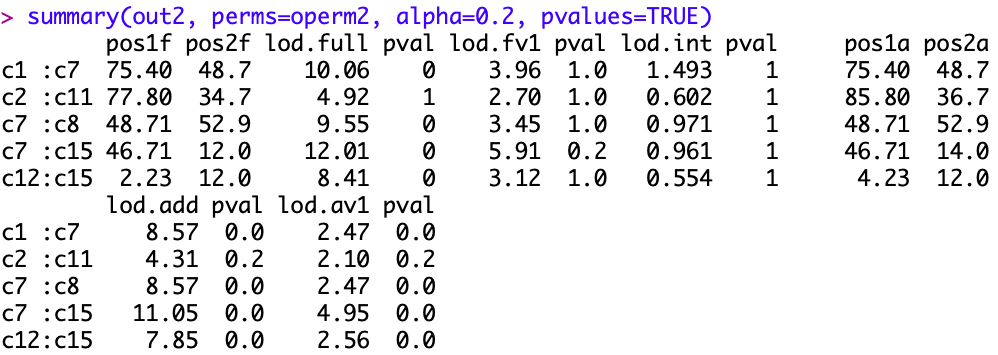
The following codes detect the regions with LOD 4.04.
sug <- calc.genoprob(sug, step=1)
out.all <- scanone(sug, pheno.col=1:4, method="hk")
summary(out.all, threshold=3, format="tabByCol")
lls2:
chr pos ci.low ci.high lod
c3.loc15 3 15 3 36 4.04
But the following codes fail to detect the regions with LOD ore than 3
out.all <- scanone(sug, pheno.col=1:4, method="hk")
summary(out.all, threshold=3)
There were no LOD peaks above the threshold.
Why is it so?
To view this discussion on the web visit https://groups.google.com/d/msgid/rqtl-disc/6A613372-234A-420D-9013-70044B6747AE%40gmail.com.
For more options, visit https://groups.google.com/d/optout.