Odd Results with StepwiseQTL / Renumbering markers
34 views
Skip to first unread message

sean.t...@gmail.com
Dec 16, 2021, 11:17:13 AM12/16/21
to R/qtl discussion
Hello,
I'm getting an odd (maybe) results for QTL on chr 10 after running the following code:
--------
load("AllTests.RData", verbose=T)
load("ds_t1.t2perms.Rdata")
pht<-"ds_t1.t2"
load("ds_t1.t2perms.Rdata")
pht<-"ds_t1.t2"
x<-calc.genoprob(x, step=0.5, error.prob=0.05, map.function="kosambi")
step5<-stepwiseqtl(x, pheno.col=pht, method="hk", model="normal", max.qtl=5,
penalties=pens,additive.only=FALSE, refine.locations=TRUE, keeptrace=TRUE, keeplodprofile=TRUE)
penalties=pens,additive.only=FALSE, refine.locations=TRUE, keeptrace=TRUE, keeplodprofile=TRUE)
summary(fitqtl(x, qtl=step5, formula=formula(step5), pheno.col=pht, method="hk", model="normal", get.ests=T, dropone=T))
---------
fitqtl summary
Method: Haley-Knott regression
Model: normal phenotype
Number of observations : 152
Full model result
----------------------------------
Model formula: y ~ Q1 + Q2 + Q3
df SS MS LOD %var Pvalue(Chi2) Pvalue(F)
Model 3 3384.068 1128.02260 19.41583 44.46988 0 0
Error 148 4225.730 28.55223
Total 151 7609.798
Drop one QTL at a time ANOVA table:
----------------------------------
df Type III SS LOD %var F value Pvalue(Chi2) Pvalue(F)
8@82.5 1 1408 9.490 18.50 49.30 0 7.38e-11 ***
10@60.1 1 1399 9.439 18.38 48.99 0 8.31e-11 ***
10@60.5 1 1608 10.642 21.13 56.31 0 5.33e-12 ***
---
Signif. codes: 0 ‘***’ 0.001 ‘**’ 0.01 ‘*’ 0.05 ‘.’ 0.1 ‘ ’ 1
Estimated effects:
-----------------
est SE t
Intercept 9.3541 0.4416 21.183
8@82.5 3.0682 0.4370 7.022
10@60.1 -18.8587 2.6943 -7.000
10@60.5 20.2579 2.6997 7.504
-------
for(i in 1:5)
{
print(lodint(step5,qtl.index=i,1.5))
print(lodint(step5,qtl.index=i,1.5, expandtomarkers=T))
}
{
print(lodint(step5,qtl.index=i,1.5))
print(lodint(step5,qtl.index=i,1.5, expandtomarkers=T))
}
--------
chr pos lod
c8.loc74.5 8 74.5 7.748817
c8.loc82.5 8 82.5 9.490357
c8.loc84 8 84.0 7.938556
chr pos lod
S8_8946668 8 74.29816 7.448884
c8.loc82.5 8 82.50000 9.490357
S8_25400322 8 84.60799 7.315015
chr pos lod
S10_4607462 10 59.78591 4.8316631
S10_4623022 10 60.08551 9.4386548
S10_4650857 10 60.38906 0.4902432
chr pos lod
S10_4607462 10 59.78591 4.8316631
S10_4623022 10 60.08551 9.4386548
S10_4650857 10 60.38906 0.4902432
chr pos lod
1 10 60.08551 0.000000
8 10 60.50000 10.641652
9 10 61.00000 6.148165
chr pos lod
1 10 60.08551 0.000000
8 10 60.50000 10.641652
9 10 61.00000 6.148165
----------
When I run the following code to check the LOD of individual markers:
---------
plotLodProfile(step5)
l<-attr(step5, "lodprofile")
q1<-l[[1]]
q2<-l[[2]]
q3<-l[[3]]
out<-rbind(q1,q2,q3)
write.csv(out, "swq_Test1.2_LOD.csv")
l<-attr(step5, "lodprofile")
q1<-l[[1]]
q2<-l[[2]]
q3<-l[[3]]
out<-rbind(q1,q2,q3)
write.csv(out, "swq_Test1.2_LOD.csv")
------------
I see this in .csv file where marker names switch to numbers and my LOD scores at certain positions seemingly have two values (ex. 60.890608 is both LOD 0.49 and 10.03):
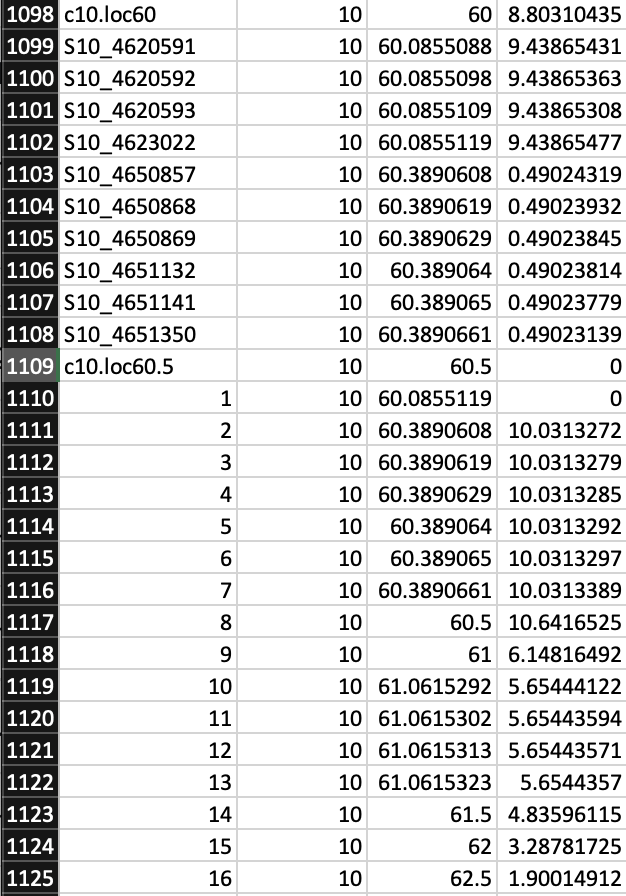
Can anyone explain what I'm looking at here? The left most column is my marker, then the chromosome, then position, then LOD score. My troubleshooting hasn't helped. To me it looks like markers "1-7" are just duplicated markers "4623022-4651350" but with different LOD scores. The numbered markers continue on for the rest of the file as well, going all the way up to 444. This is my only phenotype that has produced these results.
Thanks,
Sean

Karl Broman
Dec 16, 2021, 11:24:13 AM12/16/21
to R/qtl discussion
I can't explain the screenshot of the LOD profile output. When you
have linked QTL, the LOD profiles for the two QTL will both cover the
interval between them, so you'll have a stretch of the chromosome
repeated.
When you have a very strong QTL,
haley-knott regression can give apparent evidence for two tightly-linked
QTL. You might try the multiple imputation method.
karl
Reply all
Reply to author
Forward
0 new messages