Most of my markers have segregation distortion
208 views
Skip to first unread message

Lara
Apr 6, 2022, 2:07:37 PM4/6/22
to R/qtl discussion
Hi Dr. Broman and the R/QTL community,
I have a large concern regarding segregation distortion. I have an F2 population derived from a cross between parents of the same species. I genotyped the population using GBS/ddRADseq and both STACKS and TASSEL. The parents are inbred allotetraploid, but previous studies have demonstrated this species "behaves as a diploid" with disomic inheritance and a population has been genetically mapped using STACKS/JoinMap and ~1,000 markers.
When I use the bonferonni correction to assess for segregation distortion (see code below) I find that my markers are 88% distorted in the tassel genotyping data (4,004/4,512 markers; pval=1.108156e-05) and 97% distorted in the stacks genotyping data (3,014/3,079 markers, p.val=1.623904e-05).
Has anyone encountered this before? All I can find are discussions on removing the distorted loci (which I can't do as it's most of my data), explanations regarding increased distortion with interspecific crosses (this is the same species), different cytoplasmic environments (possibly?), preferential meiotic selection (possibly?), and infertile genotypes (I didn't notice any decrease in fertility).
Any suggestions on how to proceed would be greatly appreciated!!!
### Bonferroni correction ###
gt <- geno.table(mydata)
bon.pval.cutoff <- 0.05/totmar(mydata)
gt[gt$P.value < bon.pval.cutoff, ]
todrop <- rownames(gt[gt$P.value < bon.pval.cutoff, ])
nrow(as.data.frame(todrop))
bon.pval.cutoff <- 0.05/totmar(mydata)
gt[gt$P.value < bon.pval.cutoff, ]
todrop <- rownames(gt[gt$P.value < bon.pval.cutoff, ])
nrow(as.data.frame(todrop))
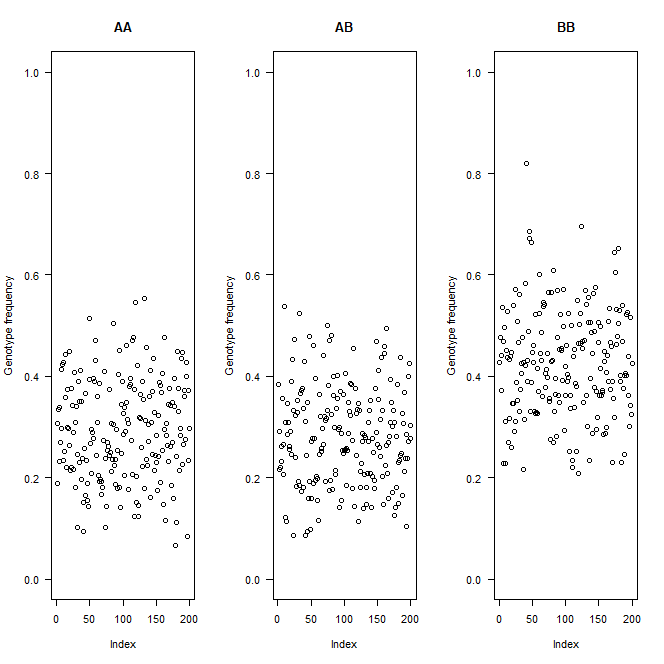
### study genotype frequencies in individuals ###
gfreq <- apply(g, 1, function(a) table(factor(a, levels=1:3)))
gfreq <- t(t(gfreq) / colSums(gfreq))
par(mfrow=c(1,3), las=1)
for(i in 1:3)
plot(gfreq[i,], ylab="Genotype frequency", main=c("AA", "AB", "BB")[i],
ylim=c(0,1))
#export as "Genotype frequencies by individual
gfreq <- apply(g, 1, function(a) table(factor(a, levels=1:3)))
gfreq <- t(t(gfreq) / colSums(gfreq))
par(mfrow=c(1,3), las=1)
for(i in 1:3)
plot(gfreq[i,], ylab="Genotype frequency", main=c("AA", "AB", "BB")[i],
ylim=c(0,1))
#export as "Genotype frequencies by individual

Karl Broman
Apr 6, 2022, 4:20:40 PM4/6/22
to R/qtl discussion
If the segregation distortion is real, then you can just ignore it. QTL mapping conditions on the observed genotypes, and so distortion has no real influence on the assessment of genotype:phenotype association, except in maybe affecting power to detect QTL, if the sample size for some genotypes are low.
So the main question is: is this real, or is it some problem in the genotyping technology? The main clue is whether linked markers along a chromosome are all showing smoothly varying allele frequencies. If there's a lot of scatter, I'd suspect genotyping errors.
karl
Lara
Apr 9, 2022, 5:32:03 PM4/9/22
to R/qtl discussion
Dr. Broman,
toswitch <- markernames(chilling, chr=c(1:26,99))
chilling <- switchAlleles(chilling, toswitch)
chilling <- formLinkageGroups(chilling, max.rf=0.35, min.lod=6, reorgMarkers=TRUE)
Thank you, this is alleviating to hear. I believe it is real as I have now tried 3 genotyping pipelines and all have come back with similar degrees of segregation distortion. There's some scatter, but for the most part, the linked markers cluster along the chromosome.
Another question I have now is, in going through your tutorial, I noticed your advice to use markerlrt() instead of est.rf() for data with rampant distortion. When I used est.rf() and then checkAlleles(), only 4 markers had an LOD>6. However, when I used markerlrt() and then checkAlleles(), 2066 markers had an LOD>6 (out of 2292 markers). I tried switching all of the markers, see code below, but after switching all genotypes, it still says 2066 markers have an LOD>6. Can this be ignored or could there be some major genotyping error? If so, how is best to proceed? Is it better to use the est.rf() in this case despite the distortion? (This change in checkalleles only happened with my dataset from STACKS not from TASSEL, however I would prefer to use the STACKS data as the chromosome lengths are more appropriate with cleaner RF v. LOD plots).
toswitch <- markernames(chilling, chr=c(1:26,99))
chilling <- switchAlleles(chilling, toswitch)
chilling <- formLinkageGroups(chilling, max.rf=0.35, min.lod=6, reorgMarkers=TRUE)
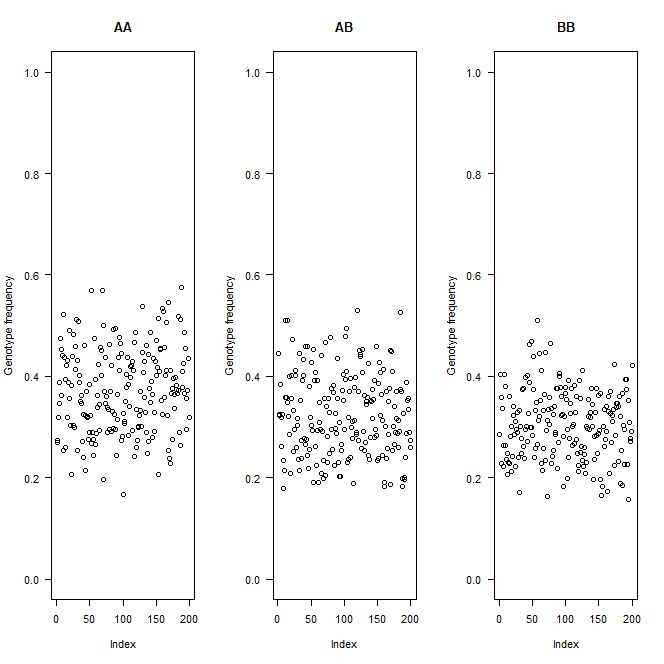
#genotypes percentages before switching: AA:30.2 AB:28.5 BB:41.4
#genotypes percentages after switching: AA:41.4 AB:28.5 BB:30.2
Karl Broman
Apr 9, 2022, 8:49:52 PM4/9/22
to R/qtl discussion
I wouldn’t switch alleles unless you really know there’s a problem. The results of markerlrt() are not appropriate for switch.alleles, so that’s something I should maybe fix, by adding an error message.
karl
Lara
Apr 11, 2022, 2:13:25 PM4/11/22
to R/qtl discussion
Okay, thank you for clarifying. I will not switch genotypes then, but is it still best to proceed with markerlrt() over est.rf() and just ignore the report that the markers have a LOD>6?
Reply all
Reply to author
Forward
0 new messages