Genetic linkage map and QTL mapping for a genome assembled to chromosomes
200 views
Skip to first unread message

Talal Al-Yazeedi
Apr 8, 2022, 10:53:18 AM4/8/22
to R/qtl discussion
Dear rqtl users,
I have generated markers genome-wide for a mosquitoes genome from 94 segregating individuals generated from crossing a mosquito resistant to an insecticide with another one that is susceptible to the insecticide. The goal is to identify genetic loci associated with resistance through QTL mapping.
The mosquitoes genome has been already assembled to a chromosomal level. The genome consists of 3 chromosomes with varying lengths between 17Mb to 99Mb. I did some initial QTL mapping by considering every Mb a cM by dividing all of the markers positions in bp by 1,000,000 to convert the position to cM. I detect a peak QTL where I was expecting.
However, in a separate analysis, I tried to construct a genetic linkage map to estimate the exact location in cM between markers. I started by removing missing, duplicated markers and markers with a significant segregation distortion. Then, I used the function est.map() however the length of chromosomes in cm was huge smallest was 6265 cM! When I tried to scan for a QTL the plot was noisy and there was no discreet peak.
I am not sure what is the best strategy to convert the bp to cM in my dataset for subsequent QTL mapping? Do you suggest linking markers to linkage groups again even though we have an assembled genome? and what is the best strategy to link the markers into linkage groups and retain the order of those markers in the assembled genome?

Karl Broman
Apr 8, 2022, 11:11:24 AM4/8/22
to R/qtl discussion
I wouldn’t try to reorder the markers; take the order in the physical assembly.
My guess is that the genotypes haven’t been coded correctly. R/qtl is principally for crosses between two inbred lines, and you’d usually code the genotypes with A = one parent and B = the other parent.
It is possible to use R/qtl for a particularly outcross, as a phase-known 4-way cross, and I presume this is what corresponds to your case. But you need to first infer phase (ie haplotypes) in the two parents, and the genotypes need to be encoded in a complicated way, described in the help file for the read.cross function.
karl
Talal Al-Yazeedi
Apr 8, 2022, 2:08:46 PM4/8/22
to R/qtl discussion
Hi Karl,
Thanks for your quick response. My initial QTL mapping by taking the order from the physical map by estimating that 1Mb = to 1cM. This has produced the result I was expecting with a peak at a genomic location we have mapped before.
Sorry if my description is misleading; The parental lines were laboratory inbred for years and they have been studied in A. funestus as the default resistant and susceptible strains to a wide range of insecticides. I have collected 94 F2 from the cross for genotyping by sequencing. The data were imported using read.cross() the genotypes data were loaded as an "f2" to retain heterozygous markers. So in my dataset, they were AA markers for the resistant parent, BB markers for susceptible and AB for heterozygous. genotypes were omitted from the dataset where parents were either missing or heterozygous. Is this the correct way to read the genotype markers for my cross?
Once I load the markers to R/qtl what is the best way to determine chromosome size in cM for qtl mapping? I assume I should use est.map() to estimate the size of chromosomes in cM?
Best,
Talal
Karl Broman
Apr 8, 2022, 2:14:53 PM4/8/22
to R/qtl discussion
est.map() is the best way to estimate inter-marker distances. If it's giving super long chromosomes, you'd then want to look at whether that's due to a few intervals, for example because there are a few problematic markers, or if there's a more pervasive problem.
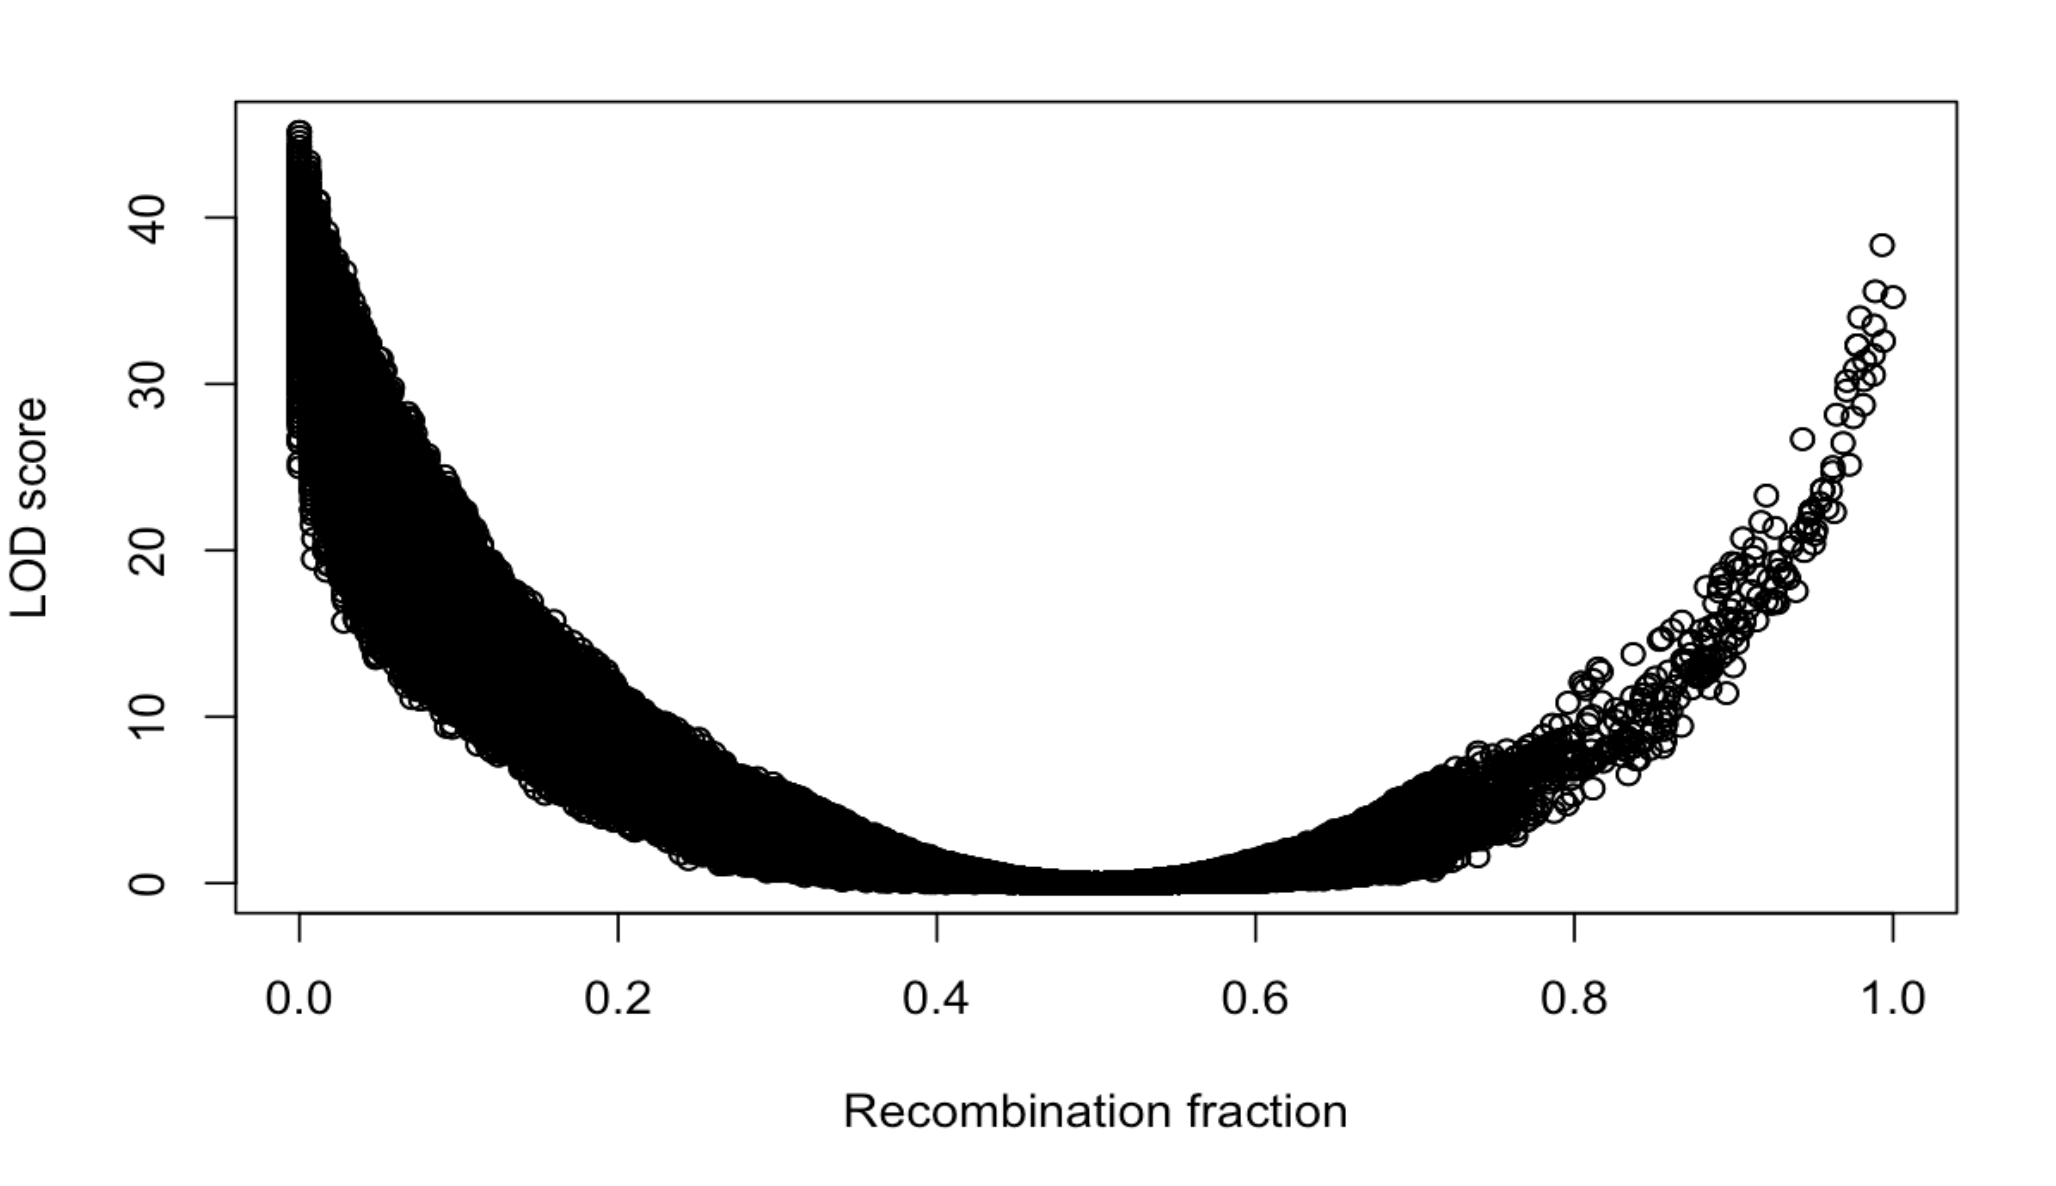
Another useful diagnostic is est.rf() and plotRF() to plot the pairwise recombination fractions for all pairs of markers.
karl
Talal Al-Yazeedi
Apr 19, 2022, 12:16:21 PM4/19/22
to R/qtl discussion
Dear Karl,
99.42120 93.43889 17.30446
I still get large linkage groups after I estimate the inter-marker distances using est.map (). I am using a large number of markers and I am not sure how to identify which markers are problematic, especially after I have already removed markers with missing values, duplicated and distorted markers. I started by converting the physical map to a genetic linkage map by considering that every 1Mb = 1cM.
1- I started by loading the markers as an R object
#load MapMaker formate into rqtl.
> A.fun.mapRILs <- read.cross("csv", "~/Documents/", "A.fun.chr.bp.csv",na.strings = "-", genotypes = c("AA","AB", "BB", "not BB", "not AA"), alleles = c("A","B"), estimate.map = FALSE, crosstype = "f2")
> A.fun.mapRILs <- read.cross("csv", "~/Documents/", "A.fun.chr.bp.csv",na.strings = "-", genotypes = c("AA","AB", "BB", "not BB", "not AA"), alleles = c("A","B"), estimate.map = FALSE, crosstype = "f2")
A.fun.mapRILs
This is an object of class "cross".
It is too complex to print, so we provide just this summary.
F2 intercross
No. individuals: 94
No. phenotypes: 1
Percent phenotyped: 100
No. chromosomes: 3
Autosomes: AfunF3_2 AfunF3_3 AfunF3_X
Total markers: 10655
No. markers: 5802 3599 1254
Percent genotyped: 92.1
Genotypes (%): AA:30.7 AB:48.2 BB:21.1 not BB:0.0
not AA:0.0
> > chrlen(A.fun.mapRILs)
AfunF3_2 AfunF3_3 AfunF3_X 99.42120 93.43889 17.30446
2- preprocessing of the markers by removing duplicated individuals, markers with a lot of missing values, duplicated markers and markers with segregation distortion.
3- Estimating recombination fraction between each pair and calculate the LOD score
4- Estimate the genetic linkage map
> map1 <- est.map(no.dist.A.fun.mapRILs)
> chrlen(map1)
> chrlen(map1)
AfunF3_2 AfunF3_3 AfunF3_X
14431.519 14818.480 2239.825
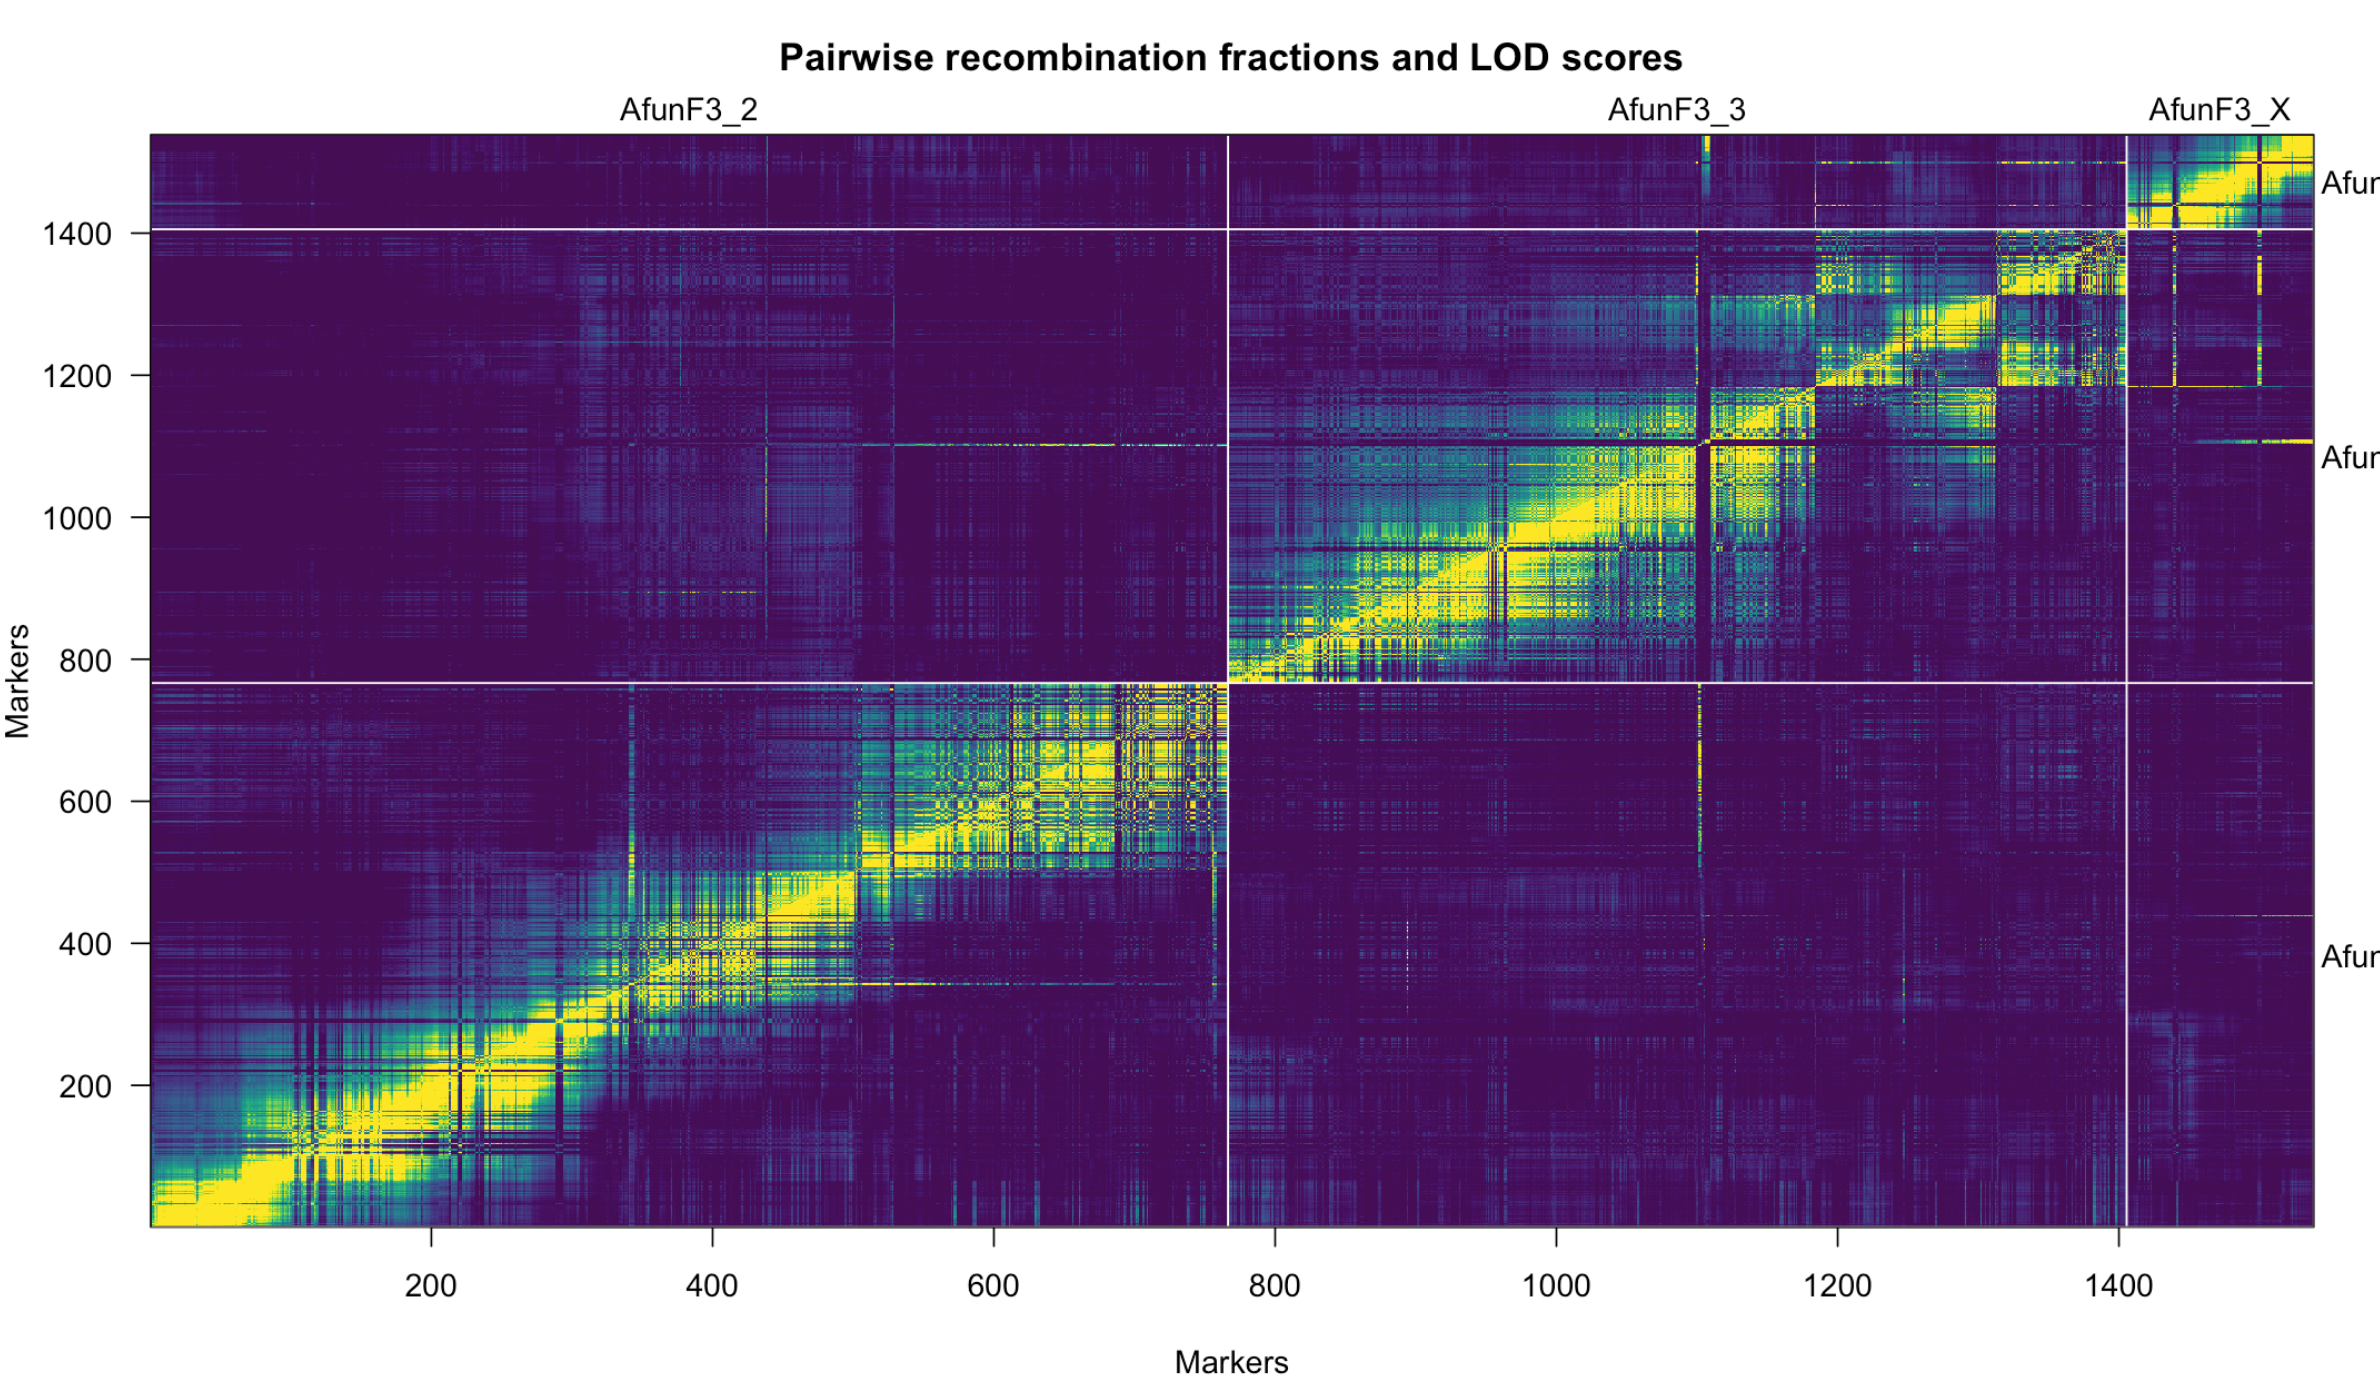
Heatmap of the linkage map after the estimation
I have been struggling to use est.map() to estimate a genetic linkage map that wouldn't be very large in size. What are your suggestions to use est.map() to estimate inter-marker distances without ending up with chromosomes with a large genetic distance?
Kind Regards,
Talal
Karl Broman
Apr 19, 2022, 12:57:03 PM4/19/22
to R/qtl discussion
You have markers with strongly associated genotypes (large LOD score) but recombination fraction near 1. You also have markers that appear to be on the wrong chromosome (the yellow streaks off the diagonal in the recombination fraction heat map). You need to fix those problems.
karl
Talal Al-Yazeedi
Apr 21, 2022, 1:49:33 PM4/21/22
to R/qtl discussion
Hi Karl,
Is there a particular function in the rqtl I can use to remove the markers that have a strong genotype association and recombination fraction near 1 and push them back to the map later on? similarly, is the same can be done for markers that appear on the wrong chromosome?
Kind Regards,
Talal
Karl Broman
Apr 21, 2022, 4:31:48 PM4/21/22
to R/qtl discussion
You can use the function drop.markers() to drop a marker or a set of markers, using their names.
I would not drop marker pairs due to the recombination fraction near 1; rather, I would try to figure out the source of the problem.
karl
Talal Al-Yazeedi
Jun 10, 2022, 12:09:42 PM6/10/22
to R/qtl discussion
Dear Karl,
To follow up on the earlier question. The general issue I had was that when I estimate the genetic linkage map from the physical map I end up with chromosomes with large CM. I over came this by constructing a genetic linkage maps, retaining the order of markers in the physical map and removing markers that did not link with the main linkage groups.
Even after I filter the markers, by removing markers that are missing in 10% of the individuals involved in the study, removing markers that are duplicated, removing individuals that share over 90% of the genotype, and removing distorted markers smaller than the bonferroni adjusted alpha level of
0.05/no.of.markers, I still get large chromosomes using est.map() function.
Size of chromosomes in cm
AfunF3_2 AfunF3_3 AfunF3_X
7913.811 7717.621 2170.854
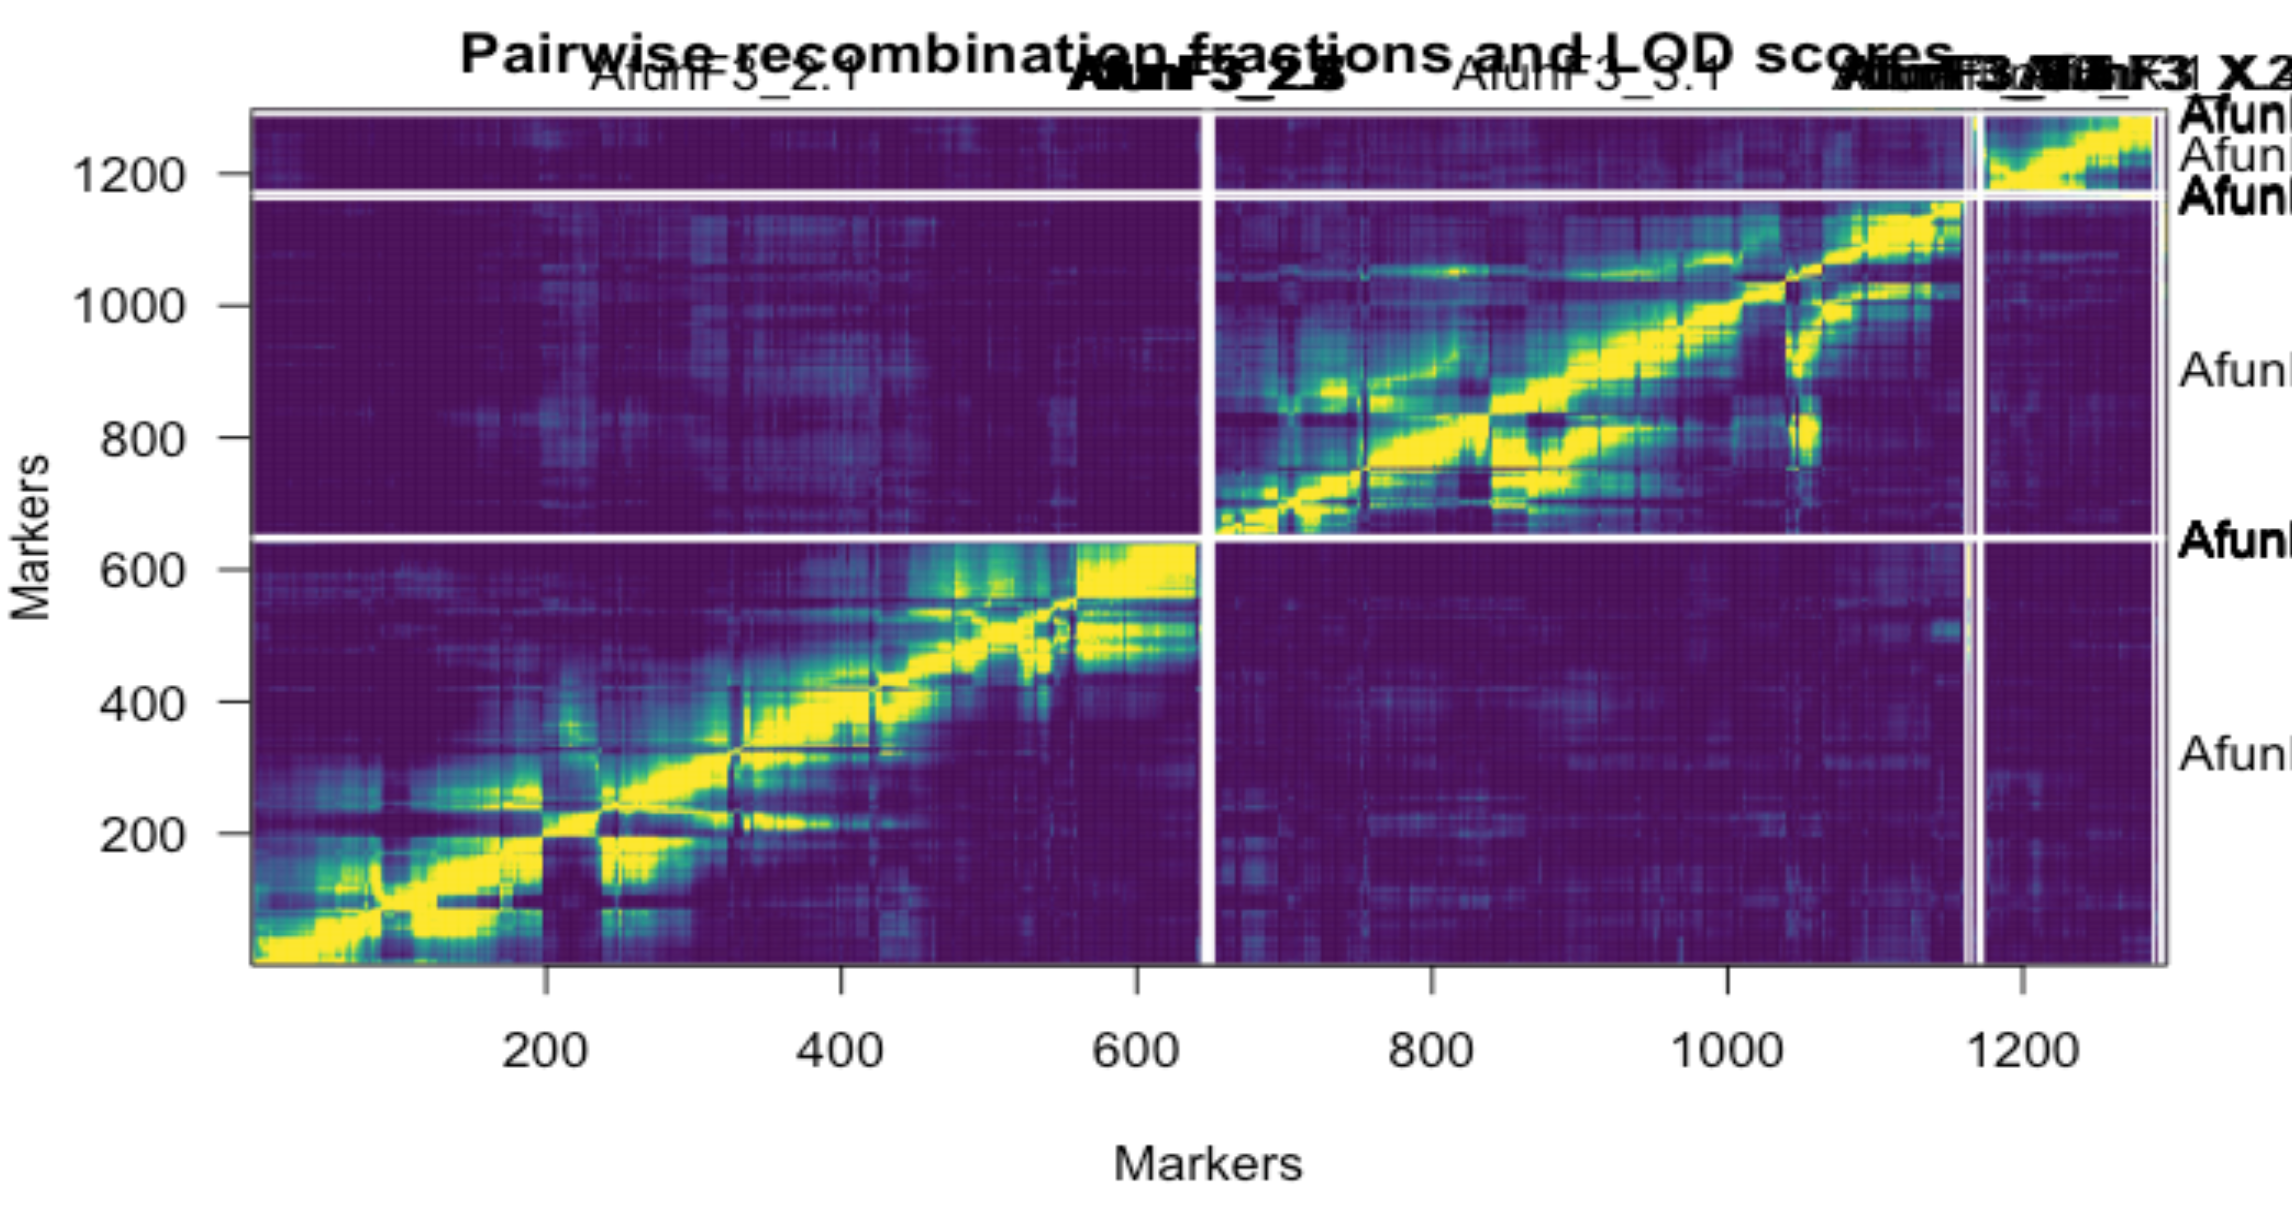
However, I tried to order markers back into linkage groups by retaining the order in the physical map and removing markers that do not order with the main three linkage groups corresponding to chromosomes. This is the result I got.
Markeres generally linked well in a discrete three linkage groups while retaining their order in the physical genome, errornous markers that didn't match with the linkage were placed in a separate small linkage group that were later subsetted from the final genetic linkage map.
The size of linkage groups after construction:
AfunF3_2.1 AfunF3_3.1 AfunF3_X.1
1047.7001 902.0483 156.5735
I know you don't comment regarding results obtained from the analysis though I have a general question regarding QTL mapping using rQTL. The only reason I am trying to get the distance between makers in cm is to scan for QTLs using the cm distance between markers.
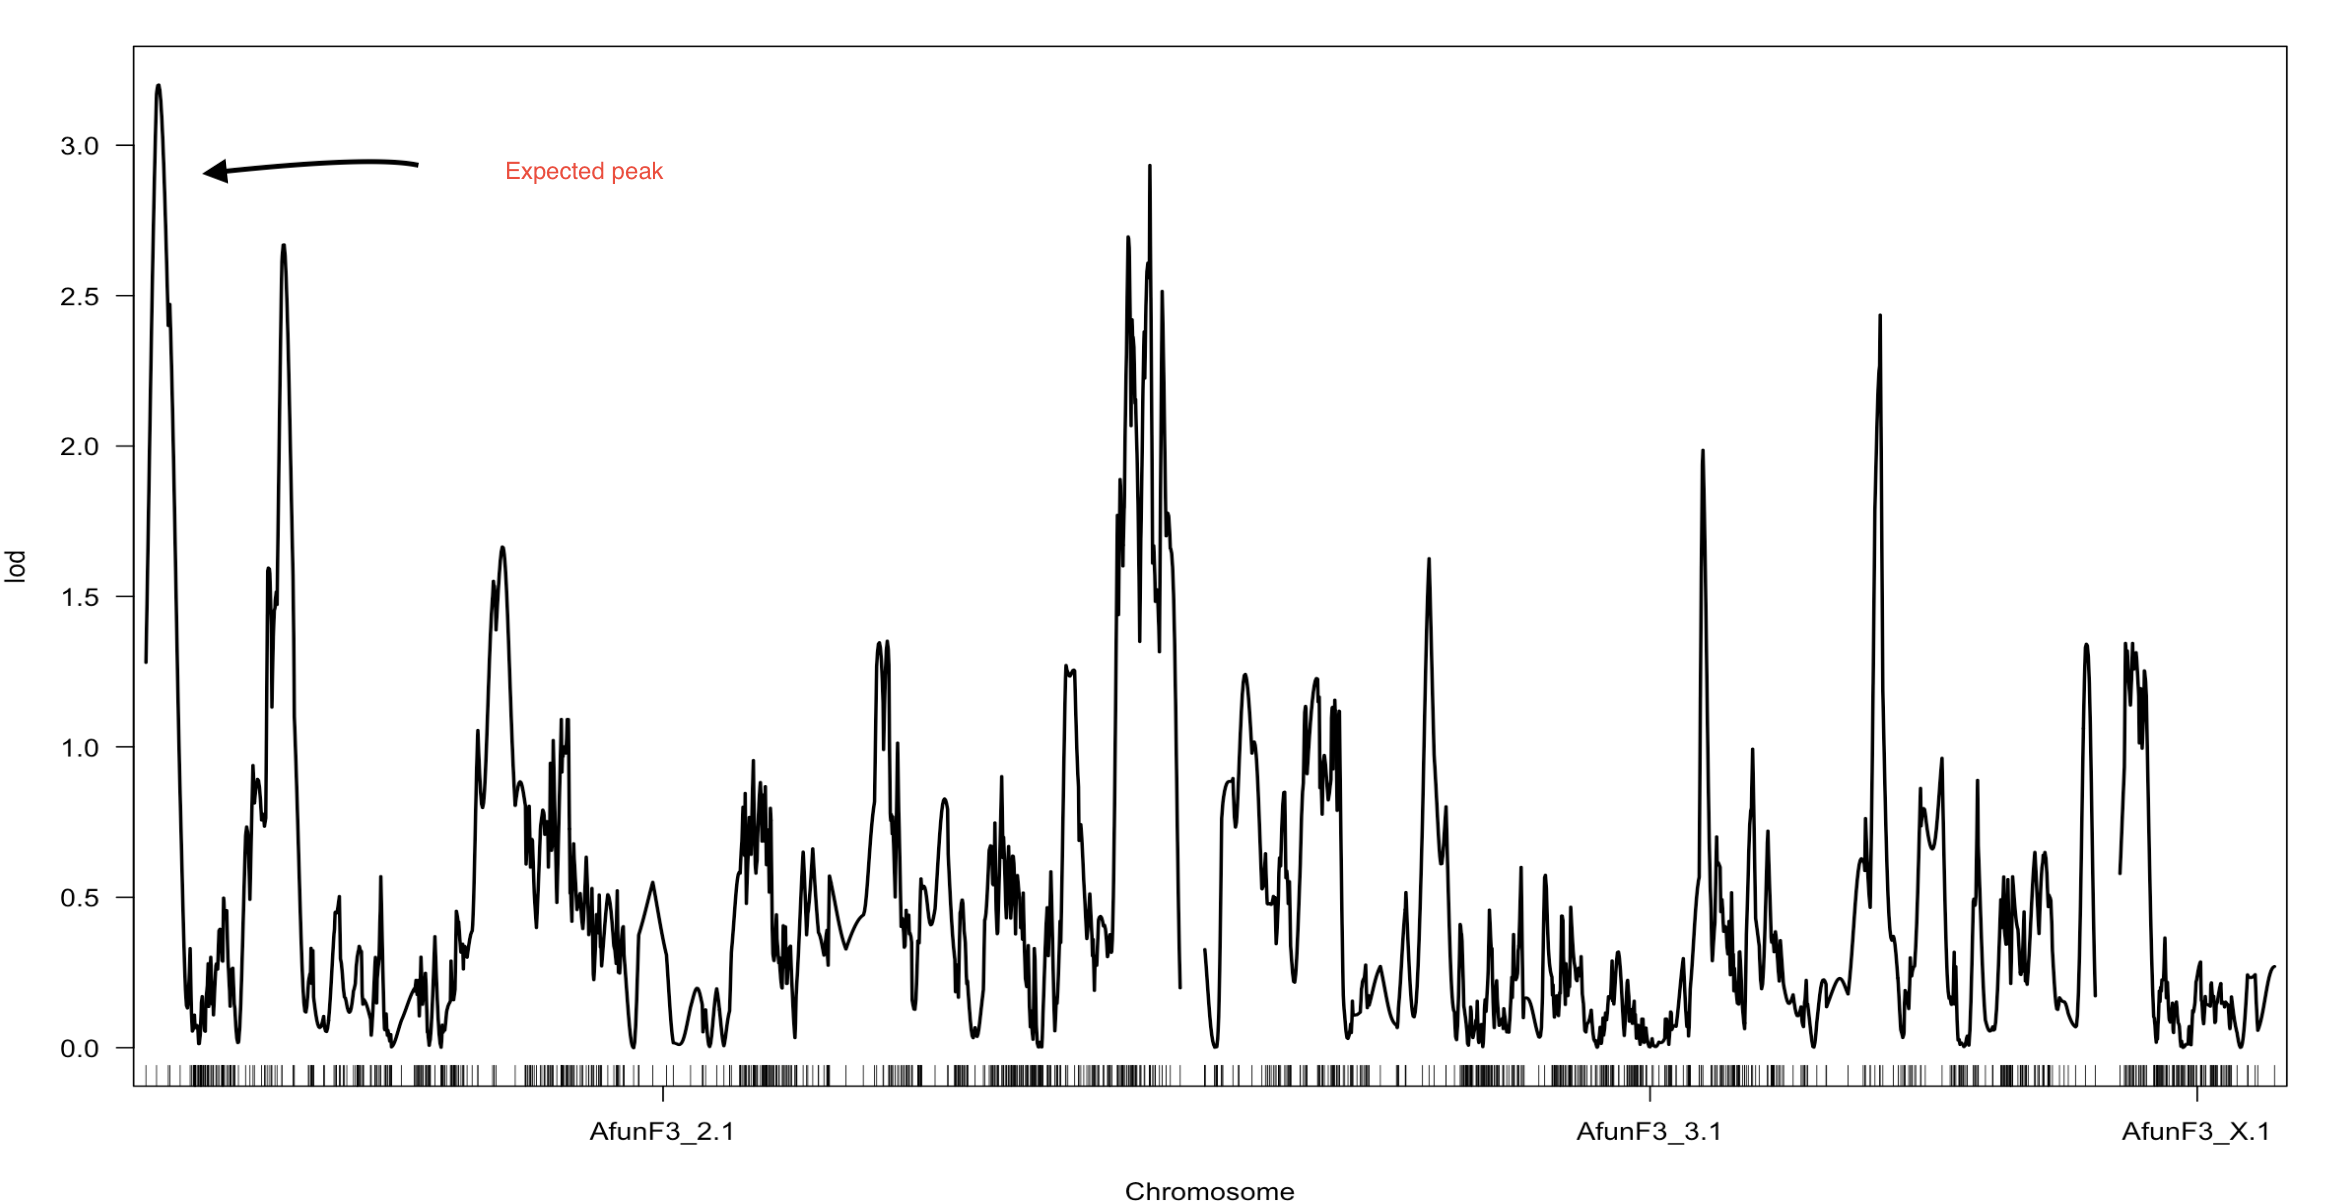
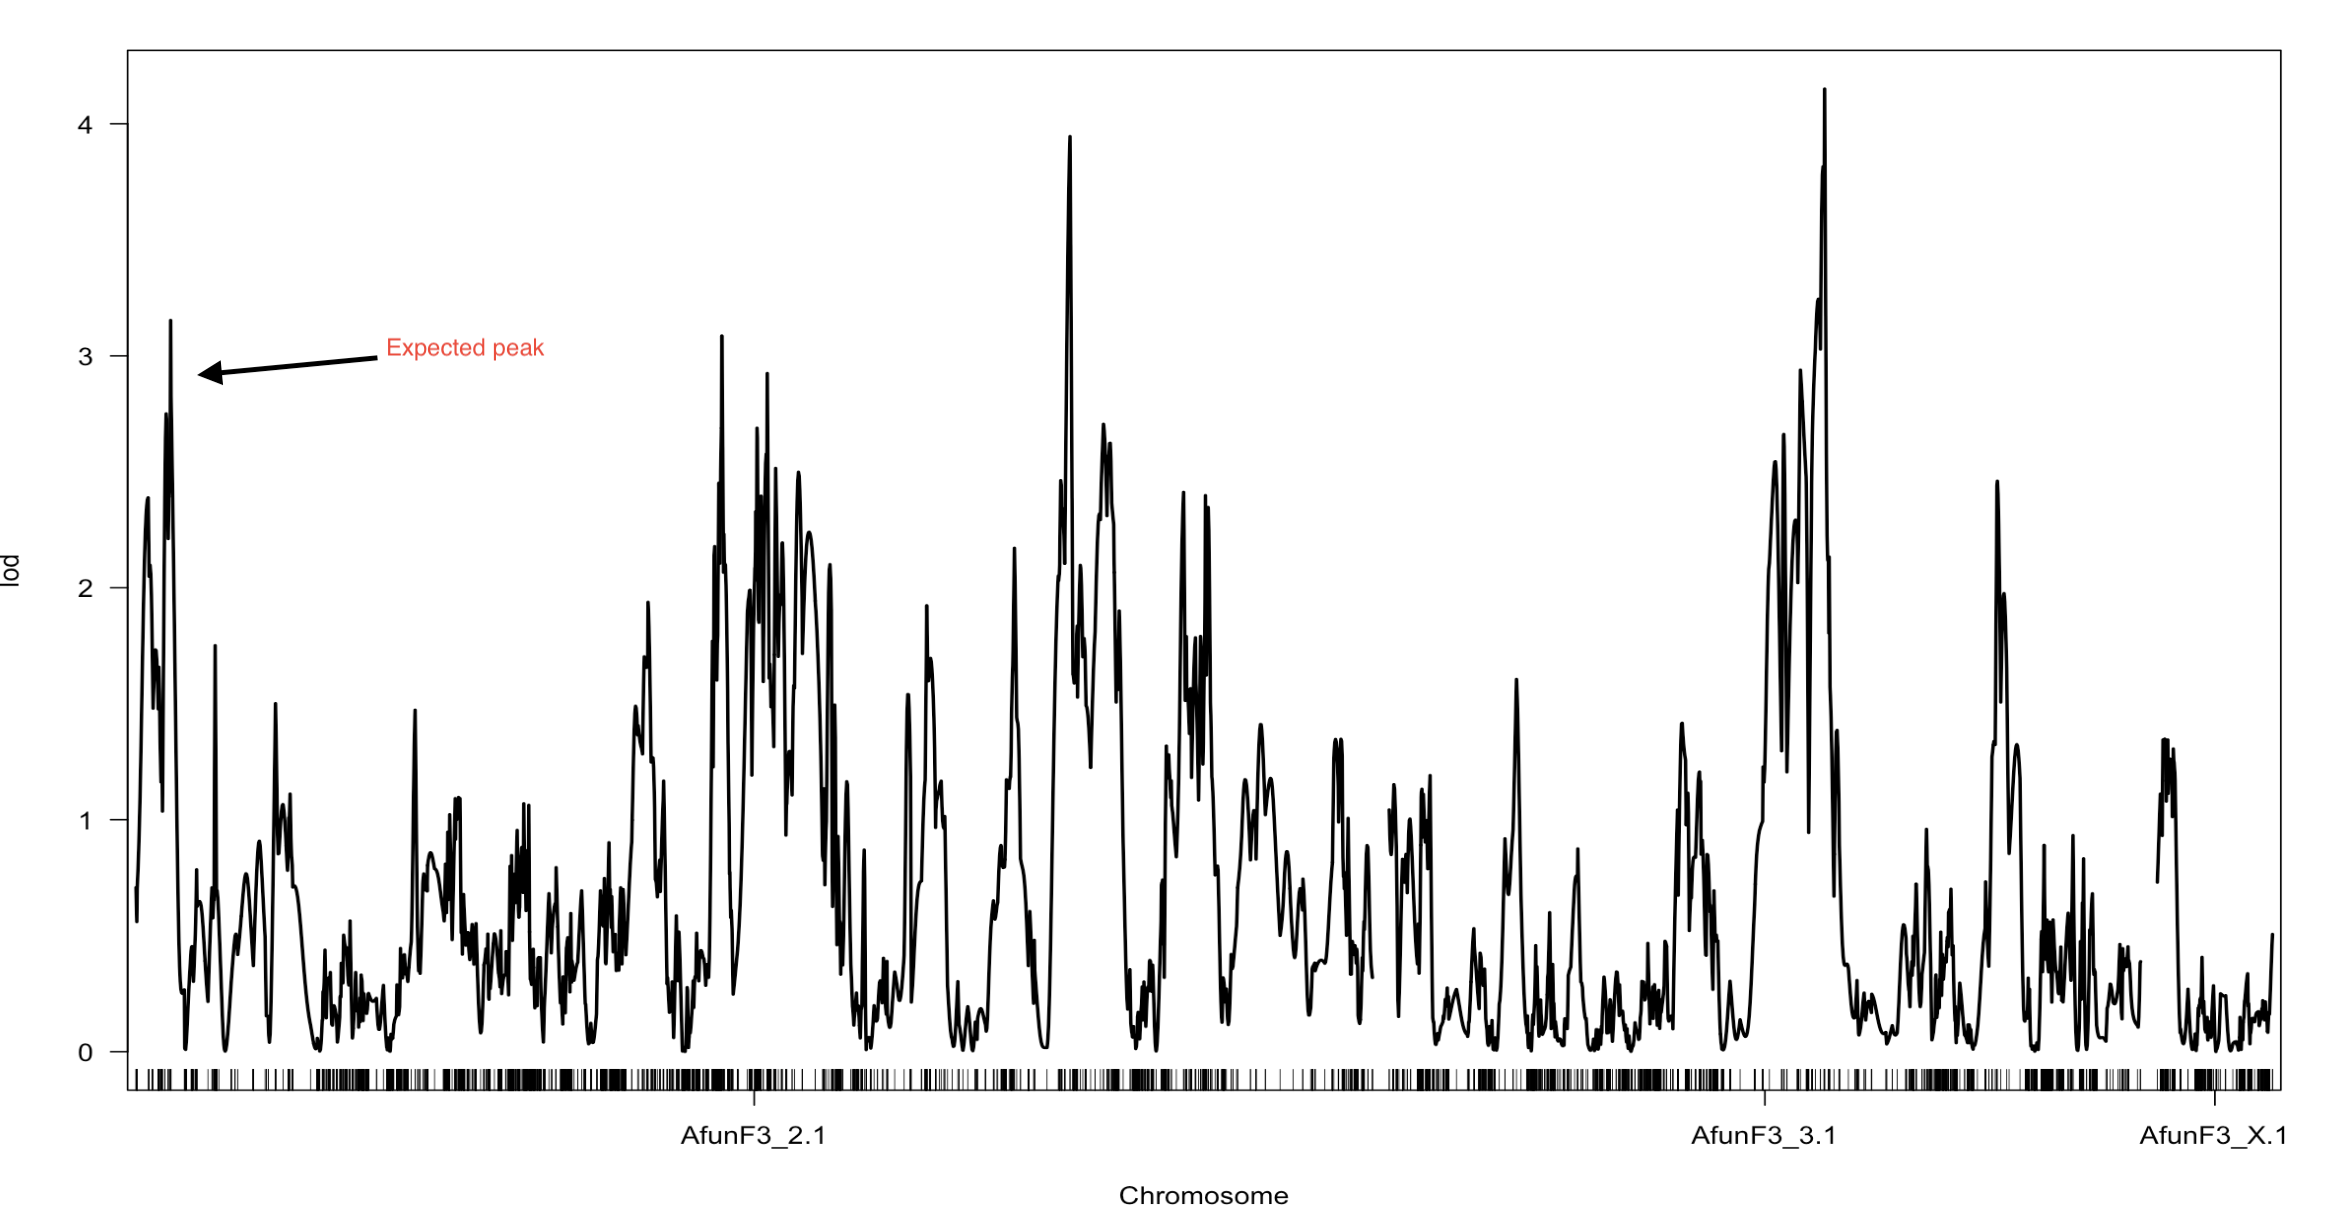
At the moment I have three datasetes to scan for a QTL with different cm distance between markers
map1- All markers datasets where CM distance was infered from the physical map by CM/Mb =1
map2- Markers with no segregation distortion, missing or duplication ordered into GLM constructed by respecting markers position in the physical genome. (The one outlined in the heat map)
map3- using (map2) all markers with segregation distortion, and duplicated markers were pushed back to the map2, without constructing a new map only assigning the most suitable linkage group for the pushed back markers.
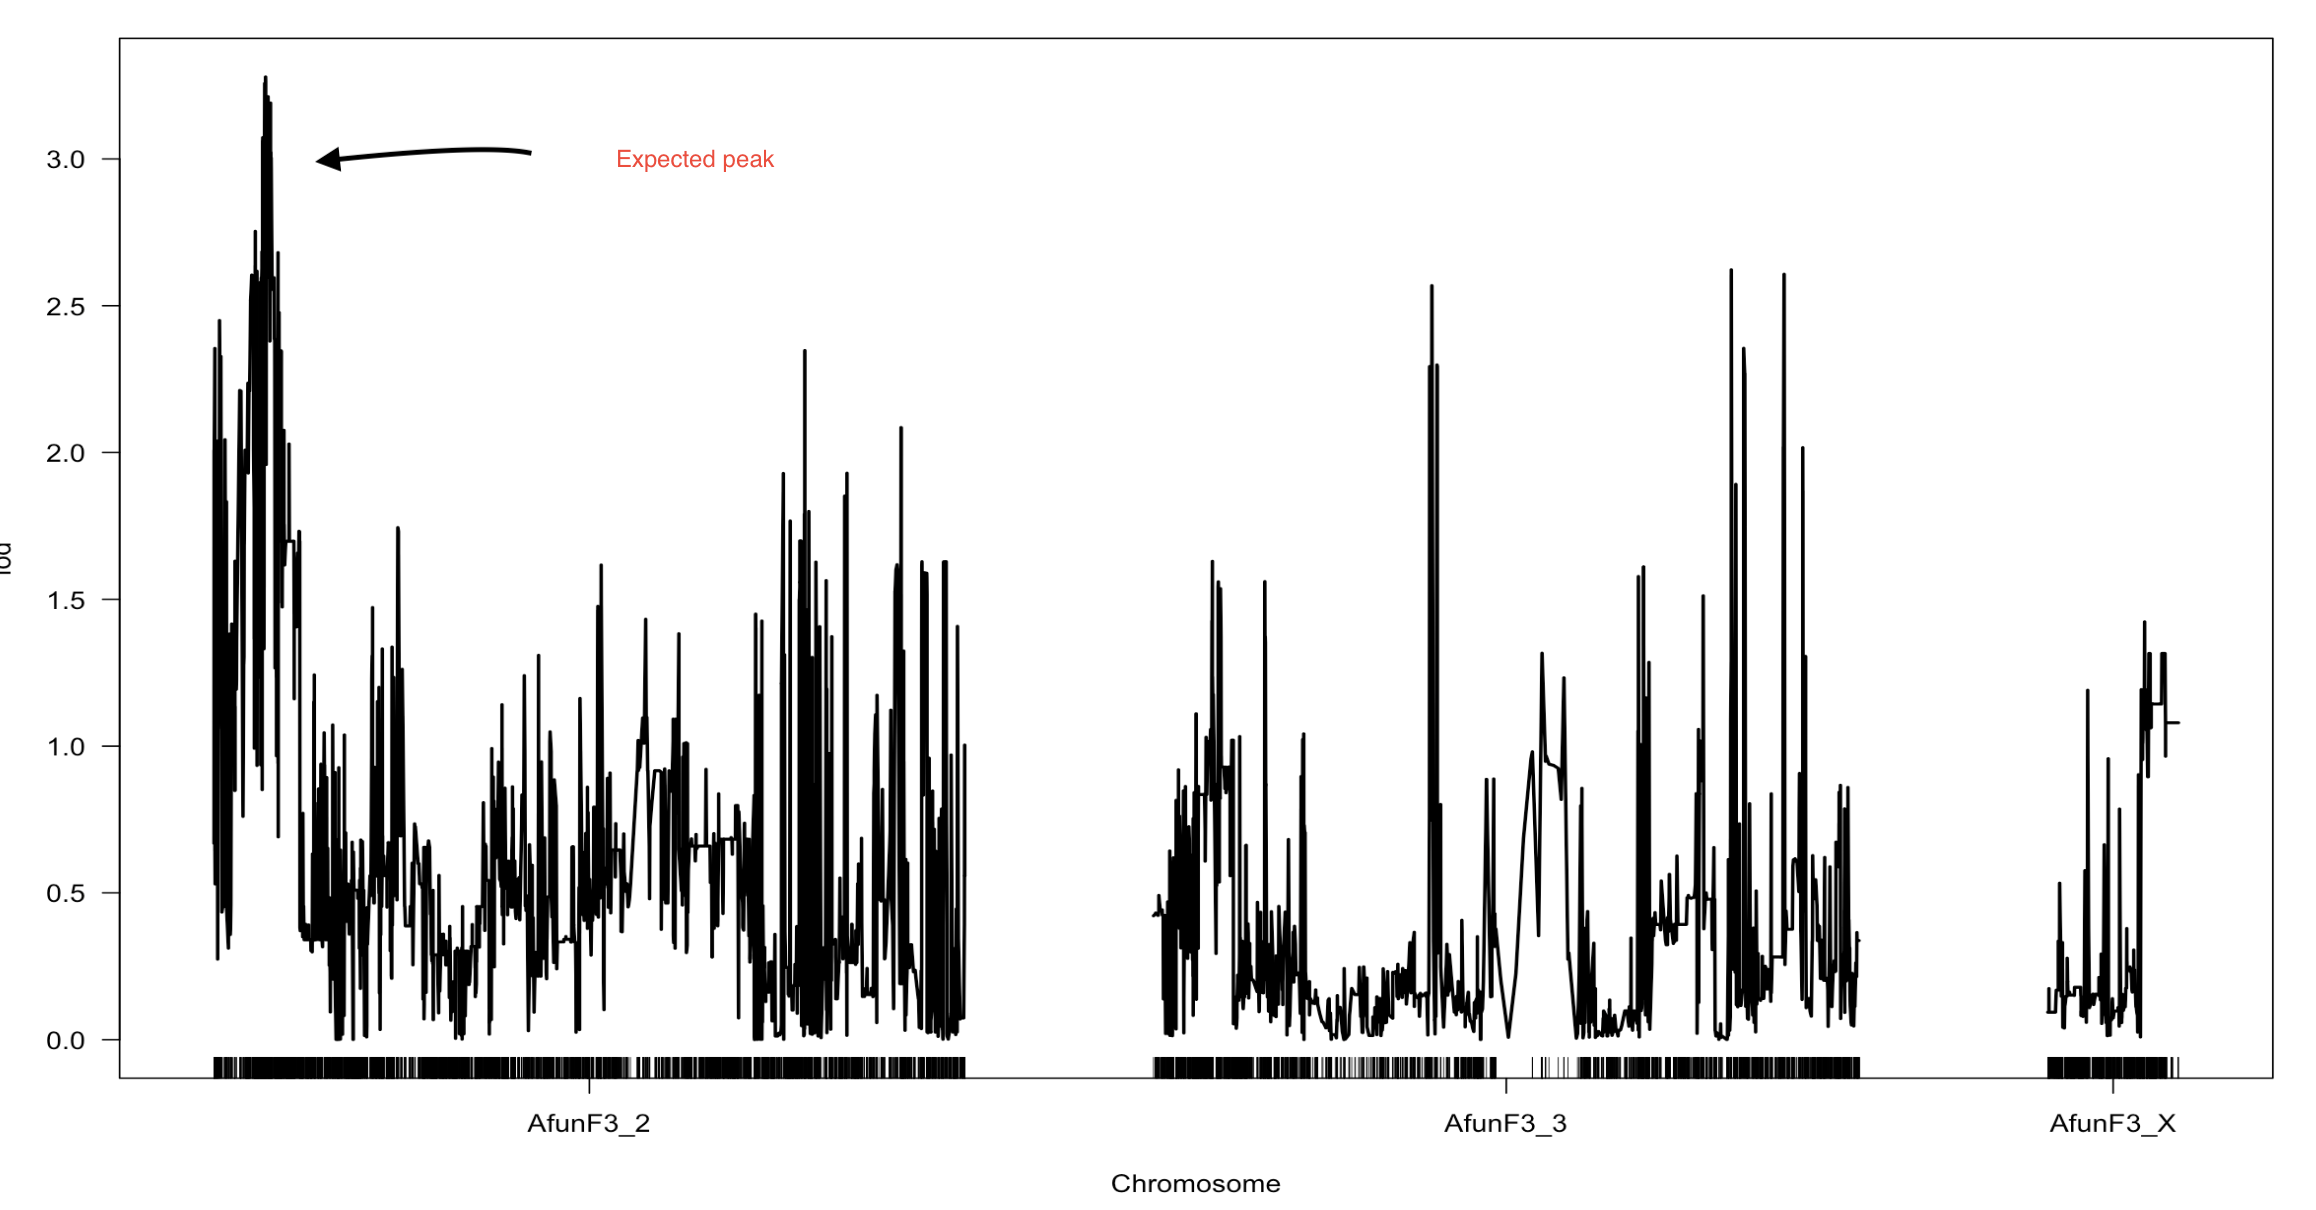
For each map the QTL peaks differ, however the expected peak at the beginning of Afun3_2 was present in all of them with different LOD score in each scan. I would like to know why there are different QTL peaks depending on the type of markers used (filtered from segregation...etc or not) and depending on the difference in cm distance between markers?
Karl Broman
Jun 10, 2022, 3:01:14 PM6/10/22
to R/qtl discussion
If the chromosomes are being estimated to be excessively long, then there remain some problems in the genotype data.
I think there are different QTL peaks based on filtering of the markers, because the original marker data has nearby markers whose genotypes are not entirely consistent with each other.
karl
Reply all
Reply to author
Forward
0 new messages