Problems with Interaction plot
22 views
Skip to first unread message

nata...@gmail.com
Jul 29, 2021, 7:26:03 AM7/29/21
to R/qtl discussion
Hi,
I'm using the effectplot() with 2 markers and there's something wrong with the graph.
for example:
Here's the data:
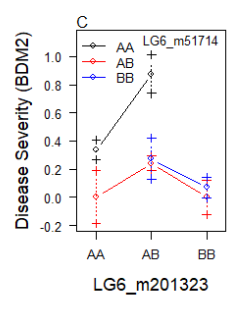
$BDM2$Means
201323.AA 201323.AB 201323.BB
51714.AA 0.3368516 0.8748651 0.00000000
51714.AB 0.0000000 0.2424017 0.00000000
51714.BB 0.0000000 0.2773551 0.06912045
$BDM2$SEs
201323.AA 201323.AB 201323.BB
51714.AA 0.06789491 0.13684382 0.38972611
51714.AB 0.18725105 0.05095344 0.12252230
51714.BB 0.38629296 0.14511003 0.07196057
Thanks a lot,
Nataly

Karl Broman
Jul 29, 2021, 8:42:55 AM7/29/21
to R/qtl discussion
The line segments missing from the graph indicate that there are no individuals with the double-recombinant (AA,BB) and (BB,AA) genotypes.
But I would expect that the output would have NA for those values, such as in the example below, where the (AA,BB) genotype is absent.
karl
set.seed(20210729)
library(qtl)
data(fake.f2)
fake.f2 <- sim.geno(fake.f2, n.draws=128, step=1)
(out_effplot <- effectplot(fake.f2, mname1="1@5", mname2="1@7"))
$Means
1...@7.0.AA 1...@7.0.AB 1...@7.0.BB
1...@5.0.AA 21.44141 20.17869 NA
1...@5.0.AB 22.67253 24.56918 18.60580
1...@5.0.BB 17.75186 22.19160 25.44724
$SEs
1...@7.0.AA 1...@7.0.AB 1...@7.0.BB
1...@5.0.AA 0.6455828 4.4105666 NA
1...@5.0.AB 5.4346461 0.5265628 9.3071026
1...@5.0.BB 4.5490475 6.8012948 0.7549752
nata...@gmail.com
Jul 29, 2021, 1:22:46 PM7/29/21
to R/qtl discussion
Thanks
It happened only when both markers are on the same chr
and as you mentioned, the second one has NA:
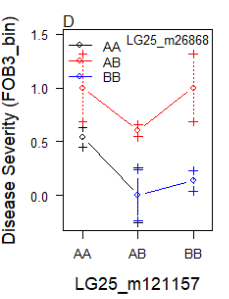
$FOB3_bin$Means
121157.AA 121157.AB 121157.BB
26868.AA 0.5416667 0.0003090243 NA
26868.AB 1.0000000 0.6028191068 1.0000000
26868.BB NA 0.0000000000 0.1363636
$FOB3_bin$SEs
121157.AA 121157.AB 121157.BB
26868.AA 0.09080416 0.25694735 NA
26868.AB 0.31455483 0.05714834 0.31455483
26868.BB NA 0.23790311 0.09484185
If I have the values as in my first example, how can I fix the graph?
ב-יום חמישי, 29 ביולי 2021 בשעה 15:42:55 UTC+3, Karl Broman כתב/ה:
Karl Broman
Jul 29, 2021, 2:12:32 PM7/29/21
to R/qtl discussion
I don't think I have a good answer to your question, "If I have the values as in my first example, how can I fix the graph?"
If you have values as in the first example (with no NAs), than I think they all should be shown in the graph. If there are NAs in the results, it is because those genotypes are unobserved, and I don't think there's a solution for that.
karl
nata...@gmail.com
Aug 1, 2021, 1:17:51 PM8/1/21
to R/qtl discussion
I had a mistake,
found it.
thanks a lot!
Nataly
ב-יום חמישי, 29 ביולי 2021 בשעה 21:12:32 UTC+3, Karl Broman כתב/ה:
Reply all
Reply to author
Forward
0 new messages