Multiple phenotypes: multivariate regression vs loop over single traits
40 views
Skip to the first unread message

Lena Flörl
30 Jan 2023, 18:46:4030/01/2023
to R/qtl discussion
Dear r/qtl forum, Dear Karl,
I am using r/qtl to map complex and quite heterogeneous phonology to my F1 population.
Until now I used a loop to run scanone(data, method="hk", model = c('normal')) on each trait individually. Then I tried scanone(data, method="hk", model = c('normal'), pheno.col=1:4) for the interval mapping of all traits in one scan. According to the r/qtl manual this should be multivariate regression.
I noticed that my LOD thresholds at 1000 permutations as well as the resulting peaks vary and I wonder what the underlying difference between mapping individual traits vs multivariate regression could be and what method I should be using?
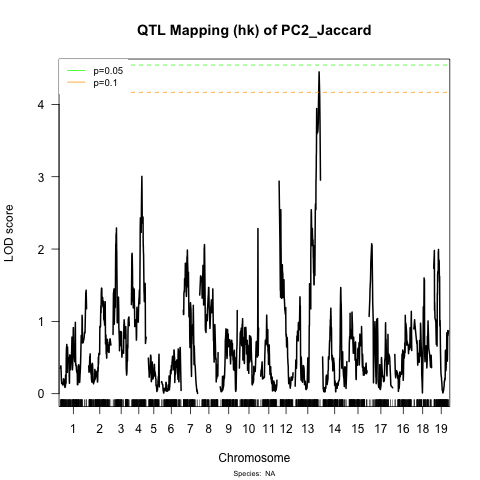
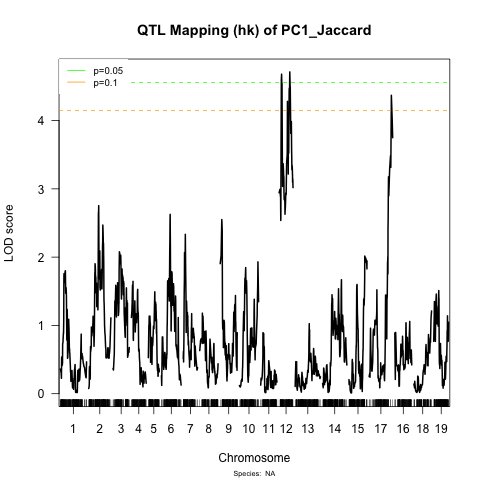
The differences are really pretty strong! I am attaching some graphs demonstrating this. For example, when I scan the traits individually I do find 2 QTLs on chromosome 12 for trait PC1 but none for the other trait (see QTL_hk files). But with the simultaneous scan these QTLs for PC1 disappear and 1 QTL on chromosome 13 of trait PC1 becomes significant (see jaccard_PCoA).
Please let me know if I can provide more information or files. Thanks a lot!
Kind regards,
Lena

Karl Broman
30 Jan 2023, 18:54:3330/01/2023
to R/qtl discussion
The results should be identical, whether you run scanone with a single trait at a time or multiple traits at once.
The analysis isn’t really “multivariate”, as it doesn’t consider the traits jointly at all.
The differences in the graph seem to just concern the thresholds and not the LOD curves.
The permutations from scanone will be slightly different when you analyze the traits together rather than individually, as the permutations will be paired across traits rather than totally separate, but if you look at the thresholds for a given trait, they will be equivalent by the two approaches. Running scanone permutation with four traits will give you a result matrix with n.perm x 4 values, the genome-wide maximum LOD score for each permutation and for each trait.
karl
Lena Flörl
30 Jan 2023, 19:19:4430/01/2023
to R/qtl discussion
Hi Karl,
thanks a lot for the super quick reply!
I see now how both techniques should theoretically lead to the same result, I think I am just genuinely surprised by how big the differences are.
And I am not sure yet how to handle this, because sometimes when I run the permutation I get a slightly lower threshold and QTLs are significant but when I re-run they suddenly are not significant anymore.
How would you recommend handling this? Should I refer to a lower alpha threshold to get "more reliable" results or do I have to discard any QTLs that are not repeatedly significant? I am already using 1000 permutations, which seems to be the standard but maybe increasing this number would be useful as well.
Thanks again!
Kind regards,
Lena
Karl Broman
30 Jan 2023, 21:11:5330/01/2023
to R/qtl discussion
The permutation results give you an estimated threshold, and typically from about 1000 permutations the standard error of the 5% threshold is about 0.1.
So I wouldn’t worry so much about the variability in the estimated thresholds, and try not to worry about the QTL having LOD scores just above or just below the threshold. It’s maybe better to focus on the p-value, and now that p=0.048 is really no different from p=0.052 and so shouldn’t be treated any different.
You could increase the permutations to 10,000, but still you shouldn’t discard QTL that aren’t above the threshold. For example, the chr 12 locus for PC2 is well below the significance threshold, but it seems to coincide with the left peak on chr 12 for PC1.
karl
Lena Flörl
31 Jan 2023, 15:18:4631/01/2023
to R/qtl discussion
Dear Karl,
thanks a lot for the explanation - I'll have a closer look at the p-values then!
Cheers!
Lena
Reply all
Reply to author
Forward
0 new messages