Running SCM in ORA
22 views
Skip to first unread message

Hovig Tchalian
Dec 22, 2017, 7:02:06 PM12/22/17
to ORA Google Group
I'm importing files into ORA, to run and visualize the outputs for SCM analysis. I've imported files (csv, two mode network) with the import wizard then run the analysis (Pull-down menu: Analysis > SCM).
When I visualize, how do I know the resulting network is running SCM? Output looks like a more standard network analysis rather than a 2D reduction.
Thanks

Ian McCulloh
Dec 24, 2017, 8:30:30 PM12/24/17
to ORA-goog...@googlegroups.com
What is SCM analysis?
--
Computational Analysis of Social and Organizational Systems (CASOS)
The Institute for Software Research, Department of Computer Science
Carnegie Mellon University, Pittsburgh, PA, USA
http://casos.cs.cmu.edu/
---
You received this message because you are subscribed to the Google Groups "ORA Google Group" group.
To unsubscribe from this group and stop receiving emails from it, send an email to ORA-google-group+unsubscribe@googlegroups.com.
Visit this group at https://groups.google.com/group/ORA-google-group.
For more options, visit https://groups.google.com/d/optout.
Hovig Tchalian
Dec 25, 2017, 11:49:47 AM12/25/17
to ORA-goog...@googlegroups.com
It's a newly available option in NetScenes, a dimensionality-reduction technique called Socio-Cognitive Modeling. It's available under the Analysis pull-down menu.
When I run it and then visualize, the output looks more like standard network visualization than what I was expecting to see with SCM.
On Sun, Dec 24, 2017 at 5:30 PM Ian McCulloh <cus...@gmail.com> wrote:
What is SCM analysis?On Fri, Dec 22, 2017 at 7:02 PM, Hovig Tchalian <hovig.t...@gmail.com> wrote:I'm importing files into ORA, to run and visualize the outputs for SCM analysis. I've imported files (csv, two mode network) with the import wizard then run the analysis (Pull-down menu: Analysis > SCM).When I visualize, how do I know the resulting network is running SCM? Output looks like a more standard network analysis rather than a 2D reduction.Thanks--
Computational Analysis of Social and Organizational Systems (CASOS)
The Institute for Software Research, Department of Computer Science
Carnegie Mellon University, Pittsburgh, PA, USA
http://casos.cs.cmu.edu/
---
You received this message because you are subscribed to the Google Groups "ORA Google Group" group.
To unsubscribe from this group and stop receiving emails from it, send an email to ORA-google-gro...@googlegroups.com.
Visit this group at https://groups.google.com/group/ORA-google-group.
For more options, visit https://groups.google.com/d/optout.
--
Computational Analysis of Social and Organizational Systems (CASOS)
The Institute for Software Research, Department of Computer Science
Carnegie Mellon University, Pittsburgh, PA, USA
http://casos.cs.cmu.edu/
---
You received this message because you are subscribed to a topic in the Google Groups "ORA Google Group" group.
To unsubscribe from this topic, visit https://groups.google.com/d/topic/ORA-google-group/nVACHQ_MzLw/unsubscribe.
To unsubscribe from this group and all its topics, send an email to ORA-google-gro...@googlegroups.com.

Kathleen Carley
Dec 27, 2017, 4:15:33 AM12/27/17
to ORA-goog...@googlegroups.com
What visualizer did you use? If you have scm coordinates use the option under the 2 d visualizer for the coordinates. I’ll try to post example
Sent from my iPhone
--
Hovig Tchalian
Dec 27, 2017, 1:06:15 PM12/27/17
to ORA-goog...@googlegroups.com
Thanks.
Here are the steps I go through: (1) upload file (two-mode, csv); (2) run SCM analysis; (3) visualize results; (4) select 2D reduction option under "layout" menu; (5) deselect "normalize" checkbox and update visualization.
Also, I realize that the algorithm runs an iterative optimization, set to 5 repetitions. But I'm confused about the very different visualizations ORA generates for every run - coordinates shift although relative proximity of nodes seems to remain constant.
I end up running each analysis ten times, to tabulate overall fit and the entire range of errors, for publication purposes. But on a practical level, any suggestions about how to deal with the multiple 2D plots?
You received this message because you are subscribed to a topic in the Google Groups "ORA Google Group" group.
To unsubscribe from this topic, visit https://groups.google.com/d/topic/ORA-google-group/nVACHQ_MzLw/unsubscribe.
To unsubscribe from this group and all its topics, send an email to ORA-google-gro...@googlegroups.com.
Kathleen Carley
Jan 4, 2018, 4:12:34 PM1/4/18
to ORA List
For SCM visualization -
first run SCM and save the lat lon etc
then
use the 2d visualizer
then under layouts select multi-dimensional layout
then tell it number of dimensions 1 2 or 3
then - point it to the attributes you saved with the lat lon etc
it will give you the image you want
you can then size or color nodes by other attributes or network measures
you can also only show lines > than or < than some value ...
On Wed, Dec 27, 2017 at 1:06 PM, Hovig Tchalian <hovig.t...@gmail.com> wrote:
Thanks.Here are the steps I go through: (1) upload file (two-mode, csv); (2) run SCM analysis; (3) visualize results; (4) select 2D reduction option under "layout" menu; (5) deselect "normalize" checkbox and update visualization.Also, I realize that the algorithm runs an iterative optimization, set to 5 repetitions. But I'm confused about the very different visualizations ORA generates for every run - coordinates shift although relative proximity of nodes seems to remain constant.I end up running each analysis ten times, to tabulate overall fit and the entire range of errors, for publication purposes. But on a practical level, any suggestions about how to deal with the multiple 2D plots?
On Wed, Dec 27, 2017 at 1:15 AM Kathleen Carley <car...@andrew.cmu.edu> wrote:
What visualizer did you use? If you have scm coordinates use the option under the 2 d visualizer for the coordinates. I’ll try to post exampleSent from my iPhoneI'm importing files into ORA, to run and visualize the outputs for SCM analysis. I've imported files (csv, two mode network) with the import wizard then run the analysis (Pull-down menu: Analysis > SCM).--When I visualize, how do I know the resulting network is running SCM? Output looks like a more standard network analysis rather than a 2D reduction.Thanks
Computational Analysis of Social and Organizational Systems (CASOS)
The Institute for Software Research, Department of Computer Science
Carnegie Mellon University, Pittsburgh, PA, USA
http://casos.cs.cmu.edu/
---
You received this message because you are subscribed to the Google Groups "ORA Google Group" group.
To unsubscribe from this group and stop receiving emails from it, send an email to ORA-google-group+unsubscribe@googlegroups.com.
Visit this group at https://groups.google.com/group/ORA-google-group.
For more options, visit https://groups.google.com/d/optout.
--
Computational Analysis of Social and Organizational Systems (CASOS)
The Institute for Software Research, Department of Computer Science
Carnegie Mellon University, Pittsburgh, PA, USA
http://casos.cs.cmu.edu/
---
You received this message because you are subscribed to a topic in the Google Groups "ORA Google Group" group.
To unsubscribe from this topic, visit https://groups.google.com/d/topic/ORA-google-group/nVACHQ_MzLw/unsubscribe.
To unsubscribe from this group and all its topics, send an email to ORA-google-group+unsubscribe@googlegroups.com.
Visit this group at https://groups.google.com/group/ORA-google-group.
For more options, visit https://groups.google.com/d/optout.
--
Computational Analysis of Social and Organizational Systems (CASOS)
The Institute for Software Research, Department of Computer Science
Carnegie Mellon University, Pittsburgh, PA, USA
http://casos.cs.cmu.edu/
---
You received this message because you are subscribed to the Google Groups "ORA Google Group" group.
To unsubscribe from this group and stop receiving emails from it, send an email to ORA-google-group+unsubscribe@googlegroups.com.
Hovig Tchalian
Jan 6, 2018, 2:41:23 PM1/6/18
to ORA-goog...@googlegroups.com
Thank you.
To unsubscribe from this group and stop receiving emails from it, send an email to ORA-google-gro...@googlegroups.com.
Visit this group at https://groups.google.com/group/ORA-google-group.
For more options, visit https://groups.google.com/d/optout.
--
Computational Analysis of Social and Organizational Systems (CASOS)
The Institute for Software Research, Department of Computer Science
Carnegie Mellon University, Pittsburgh, PA, USA
http://casos.cs.cmu.edu/
---
You received this message because you are subscribed to a topic in the Google Groups "ORA Google Group" group.
To unsubscribe from this topic, visit https://groups.google.com/d/topic/ORA-google-group/nVACHQ_MzLw/unsubscribe.
To unsubscribe from this group and all its topics, send an email to ORA-google-gro...@googlegroups.com.
Visit this group at https://groups.google.com/group/ORA-google-group.
For more options, visit https://groups.google.com/d/optout.
--
Computational Analysis of Social and Organizational Systems (CASOS)
The Institute for Software Research, Department of Computer Science
Carnegie Mellon University, Pittsburgh, PA, USA
http://casos.cs.cmu.edu/
---
You received this message because you are subscribed to the Google Groups "ORA Google Group" group.
To unsubscribe from this group and stop receiving emails from it, send an email to ORA-google-gro...@googlegroups.com.
Visit this group at https://groups.google.com/group/ORA-google-group.
For more options, visit https://groups.google.com/d/optout.
--
Computational Analysis of Social and Organizational Systems (CASOS)
The Institute for Software Research, Department of Computer Science
Carnegie Mellon University, Pittsburgh, PA, USA
http://casos.cs.cmu.edu/
---
You received this message because you are subscribed to a topic in the Google Groups "ORA Google Group" group.
To unsubscribe from this topic, visit https://groups.google.com/d/topic/ORA-google-group/nVACHQ_MzLw/unsubscribe.
To unsubscribe from this group and all its topics, send an email to ORA-google-gro...@googlegroups.com.

Jeff Reminga
Jan 11, 2018, 10:24:44 AM1/11/18
to ORA-goog...@googlegroups.com
As an additional node: in the latest release of ORA, the output SCM meta-network solutions automatically contain the output coordinates (1,2,3 dimensional) for each node.
Thank you.
To unsubscribe from this group and stop receiving emails from it, send an email to ORA-google-group+unsubscribe@googlegroups.com.
Visit this group at https://groups.google.com/group/ORA-google-group.
For more options, visit https://groups.google.com/d/optout.
--
Computational Analysis of Social and Organizational Systems (CASOS)
The Institute for Software Research, Department of Computer Science
Carnegie Mellon University, Pittsburgh, PA, USA
http://casos.cs.cmu.edu/
---
You received this message because you are subscribed to a topic in the Google Groups "ORA Google Group" group.
To unsubscribe from this topic, visit https://groups.google.com/d/topic/ORA-google-group/nVACHQ_MzLw/unsubscribe.
To unsubscribe from this group and all its topics, send an email to ORA-google-group+unsubscribe@googlegroups.com.
Visit this group at https://groups.google.com/group/ORA-google-group.
For more options, visit https://groups.google.com/d/optout.
--
Computational Analysis of Social and Organizational Systems (CASOS)
The Institute for Software Research, Department of Computer Science
Carnegie Mellon University, Pittsburgh, PA, USA
http://casos.cs.cmu.edu/
---
You received this message because you are subscribed to the Google Groups "ORA Google Group" group.
To unsubscribe from this group and stop receiving emails from it, send an email to ORA-google-group+unsubscribe@googlegroups.com.
Visit this group at https://groups.google.com/group/ORA-google-group.
For more options, visit https://groups.google.com/d/optout.
--
Computational Analysis of Social and Organizational Systems (CASOS)
The Institute for Software Research, Department of Computer Science
Carnegie Mellon University, Pittsburgh, PA, USA
http://casos.cs.cmu.edu/
---
You received this message because you are subscribed to a topic in the Google Groups "ORA Google Group" group.
To unsubscribe from this topic, visit https://groups.google.com/d/topic/ORA-google-group/nVACHQ_MzLw/unsubscribe.
To unsubscribe from this group and all its topics, send an email to ORA-google-group+unsubscribe@googlegroups.com.
Visit this group at https://groups.google.com/group/ORA-google-group.
For more options, visit https://groups.google.com/d/optout.
--
Computational Analysis of Social and Organizational Systems (CASOS)
The Institute for Software Research, Department of Computer Science
Carnegie Mellon University, Pittsburgh, PA, USA
http://casos.cs.cmu.edu/
---
You received this message because you are subscribed to the Google Groups "ORA Google Group" group.
To unsubscribe from this group and stop receiving emails from it, send an email to ORA-google-group+unsubscribe@googlegroups.com.
Hovig Tchalian
Jan 11, 2018, 10:30:11 AM1/11/18
to ORA-goog...@googlegroups.com
That's great to hear, Jeff. Thanks.
Thank you.
To unsubscribe from this group and stop receiving emails from it, send an email to ORA-google-gro...@googlegroups.com.
Visit this group at https://groups.google.com/group/ORA-google-group.
For more options, visit https://groups.google.com/d/optout.
--
Computational Analysis of Social and Organizational Systems (CASOS)
The Institute for Software Research, Department of Computer Science
Carnegie Mellon University, Pittsburgh, PA, USA
http://casos.cs.cmu.edu/
---
You received this message because you are subscribed to a topic in the Google Groups "ORA Google Group" group.
To unsubscribe from this topic, visit https://groups.google.com/d/topic/ORA-google-group/nVACHQ_MzLw/unsubscribe.
To unsubscribe from this group and all its topics, send an email to ORA-google-gro...@googlegroups.com.
Visit this group at https://groups.google.com/group/ORA-google-group.
For more options, visit https://groups.google.com/d/optout.
--
Computational Analysis of Social and Organizational Systems (CASOS)
The Institute for Software Research, Department of Computer Science
Carnegie Mellon University, Pittsburgh, PA, USA
http://casos.cs.cmu.edu/
---
You received this message because you are subscribed to the Google Groups "ORA Google Group" group.
To unsubscribe from this group and stop receiving emails from it, send an email to ORA-google-gro...@googlegroups.com.
Visit this group at https://groups.google.com/group/ORA-google-group.
For more options, visit https://groups.google.com/d/optout.
--
Computational Analysis of Social and Organizational Systems (CASOS)
The Institute for Software Research, Department of Computer Science
Carnegie Mellon University, Pittsburgh, PA, USA
http://casos.cs.cmu.edu/
---
You received this message because you are subscribed to a topic in the Google Groups "ORA Google Group" group.
To unsubscribe from this topic, visit https://groups.google.com/d/topic/ORA-google-group/nVACHQ_MzLw/unsubscribe.
To unsubscribe from this group and all its topics, send an email to ORA-google-gro...@googlegroups.com.
Hovig Tchalian
Feb 14, 2020, 6:58:17 PM2/14/20
to ORA Google Group
Hi Kathleen,
A delayed question for your response below: how do I complete the second item in your list? -
"first run SCM and save the lat lon etc"
Also, is there a guide or manual for SCM specifically?
On Thursday, January 4, 2018 at 1:12:34 PM UTC-8, Kathleen Carley wrote:
For SCM visualization -first run SCM and save the lat lon etcthenuse the 2d visualizerthen under layouts select multi-dimensional layoutthen tell it number of dimensions 1 2 or 3then - point it to the attributes you saved with the lat lon etcit will give you the image you wantyou can then size or color nodes by other attributes or network measuresyou can also only show lines > than or < than some value ...
On Wed, Dec 27, 2017 at 1:06 PM, Hovig Tchalian <hovig....@gmail.com> wrote:
Thanks.Here are the steps I go through: (1) upload file (two-mode, csv); (2) run SCM analysis; (3) visualize results; (4) select 2D reduction option under "layout" menu; (5) deselect "normalize" checkbox and update visualization.Also, I realize that the algorithm runs an iterative optimization, set to 5 repetitions. But I'm confused about the very different visualizations ORA generates for every run - coordinates shift although relative proximity of nodes seems to remain constant.I end up running each analysis ten times, to tabulate overall fit and the entire range of errors, for publication purposes. But on a practical level, any suggestions about how to deal with the multiple 2D plots?
On Wed, Dec 27, 2017 at 1:15 AM Kathleen Carley <car...@andrew.cmu.edu> wrote:
What visualizer did you use? If you have scm coordinates use the option under the 2 d visualizer for the coordinates. I’ll try to post exampleSent from my iPhone
I'm importing files into ORA, to run and visualize the outputs for SCM analysis. I've imported files (csv, two mode network) with the import wizard then run the analysis (Pull-down menu: Analysis > SCM).--When I visualize, how do I know the resulting network is running SCM? Output looks like a more standard network analysis rather than a 2D reduction.Thanks
Computational Analysis of Social and Organizational Systems (CASOS)
The Institute for Software Research, Department of Computer Science
Carnegie Mellon University, Pittsburgh, PA, USA
http://casos.cs.cmu.edu/
---
You received this message because you are subscribed to the Google Groups "ORA Google Group" group.
To unsubscribe from this group and stop receiving emails from it, send an email to ORA-goog...@googlegroups.com.
Visit this group at https://groups.google.com/group/ORA-google-group.
For more options, visit https://groups.google.com/d/optout.
--
Computational Analysis of Social and Organizational Systems (CASOS)
The Institute for Software Research, Department of Computer Science
Carnegie Mellon University, Pittsburgh, PA, USA
http://casos.cs.cmu.edu/
---
You received this message because you are subscribed to a topic in the Google Groups "ORA Google Group" group.
To unsubscribe from this topic, visit https://groups.google.com/d/topic/ORA-google-group/nVACHQ_MzLw/unsubscribe.
To unsubscribe from this group and all its topics, send an email to ORA-goog...@googlegroups.com.
Visit this group at https://groups.google.com/group/ORA-google-group.
For more options, visit https://groups.google.com/d/optout.
--
Computational Analysis of Social and Organizational Systems (CASOS)
The Institute for Software Research, Department of Computer Science
Carnegie Mellon University, Pittsburgh, PA, USA
http://casos.cs.cmu.edu/
---
You received this message because you are subscribed to the Google Groups "ORA Google Group" group.
To unsubscribe from this group and stop receiving emails from it, send an email to ORA-goog...@googlegroups.com.

Neal Altman
Feb 17, 2020, 3:06:28 PM2/17/20
to ORA Google Group
For procedural information on using the two methods available to apply SCM in ORA (SCM Analysis and the SCM Report) the respective help entries in the ORA help should be useful:
For information on the SCM method itself, consult the Socio-cultural Cognitive Maps: Dynamical Statistical Network Informatics - Publications page on the CASOS web site: http://www.casos.cs.cmu.edu/projects/projects/dsni/projectPublications.php
In addition, there are two technical reports of interest, which cover the method in detail:
Carley, Kathleen M & Morgan, Geoffrey & Levine, Joel H . (2017). Socio-Cultural Cognitive Mapping. Carnegie Mellon University, School of Computer Science, Institute for Software Research, Technical Report CMU-ISR-17-115. http://www.casos.cs.cmu.edu/publications/papers/CMU-ISR-17-115.pdf
- ORA > Main Interface > Socio-cultural Cognitive Mapping (SCM)
- ORA > Reports > Socio-cultural Cognitive Mapping
For information on the SCM method itself, consult the Socio-cultural Cognitive Maps: Dynamical Statistical Network Informatics - Publications page on the CASOS web site: http://www.casos.cs.cmu.edu/projects/projects/dsni/projectPublications.php
In addition, there are two technical reports of interest, which cover the method in detail:
Carley, Kathleen M & Morgan, Geoffrey & Levine, Joel H . (2017). Socio-Cultural Cognitive Mapping. Carnegie Mellon University, School of Computer Science, Institute for Software Research, Technical Report CMU-ISR-17-115. http://www.casos.cs.cmu.edu/publications/papers/CMU-ISR-17-115.pdf
Levine, J. H., & Carley, K. M. (2016). SCM System. (CASOS Technical Report CMU-ISR-16-108). Pittsburgh, PA, USA: Carnegie Mellon University, Center for the Computational Analysis of Social and Organization Systems (CASOS). http://www.casos.cs.cmu.edu/publications/papers/CMU-ISR-16-108-final.pdf
Neal Altman
Neal Altman
Feb 17, 2020, 3:09:30 PM2/17/20
to ORA Google Group
On Monday, February 17, 2020 at 3:06:28 PM UTC-5, Neal Altman wrote:
For procedural information on using the two methods available to apply SCM in ORA (SCM Analysis and the SCM Report) the respective help entries in the ORA help should be useful:
- ORA > Main Interface > Analysis > Socio-cultural Cognitive Mapping (SCM)
Neal Altman
Feb 17, 2020, 3:11:30 PM2/17/20
to ORA Google Group
Sorry, make the first bullet below:
- ORA > Main Interface > Analysis > Socio-cultural Cognitive Mapping (SCM)
Neal
On Monday, February 17, 2020 at 3:06:28 PM UTC-5, Neal Altman wrote:
Hovig Tchalian
Feb 17, 2020, 4:32:41 PM2/17/20
to ORA-goog...@googlegroups.com
Thanks. Let me try it.
To unsubscribe from this group and all its topics, send an email to ORA-google-gro...@googlegroups.com.
To view this discussion on the web visit https://groups.google.com/d/msgid/ORA-google-group/877b1916-a41d-4063-98da-29916d0d650e%40googlegroups.com.
Hovig Tchalian
Jul 18, 2020, 5:00:11 PM7/18/20
to ORA Google Group
Thanks for the response. The help files were useful.
I've now finished loading my matrix .csv files and running the SCM analysis, and I have a couple of additional questions about visualizing the analytical outputs in 2D. Steps I followed are below, with follow-up questions about them below steps.
Process I used
A. For each (bi-modal) matrix, ran various permutations (combination of hyper-parameters: (i) ignore zero frequencies checked / unchecked x allow negative multipliers checked / unchecked), to identify the best settings (in my case, both checked)
B. Used those hyper-parameter settings to run <25 iterations of each matrix, set at max. of 150 repetitions (with all of the runs reaching an optimal solution at <150 repetitions)
C. Picked most stable solution (= combination of most frequently occurring + global minimum chi-square error) for each matrix and output them into a separate meta-node
Follow-Up Questions:
1. Any issues or corrections with the steps above?
2. I need to use the meta-nodes of the stable solutions I created to visualize them in 2D, with the X and Y axes representing dimensions of the stable SCM solution. Do I simply select the metanode and click visualize? Doesn't bring anything up for me. I'm also not sure which measures to select (fitted frequencies, some, or all?). When I instead select the original input files and click on the row x column nodes, I'm able to bring up the visualization dialog box, but when I try to select the X and Y axes in the dialog box, the pull-down says there are no numbers to input. What am I missing?
3. The minimum chi-square errors across the stables solutions are still fairly high (between ~10k and 200k, at 3,743 DF); these are text files, with different terms as rows and columns, with co-occurrences at the intersections.
Thanks for any suggestions you can provide to what I realize is a long post.
Hovig Tchalian
Aug 2, 2020, 1:54:26 PM8/2/20
to ORA Google Group
Neal, could you please take a look at my additional question about ORA visualization - last post in the thread?
I basically need to know how to map an SCM run. Can't get it to work, and can't find info about it through the help files.
Thanks
Kathleen Carley
Aug 2, 2020, 4:02:15 PM8/2/20
to ORA List
scm generates a latitude and longitude
visualize with 2d
in 2d visualiizer then select under layouts multi-dimensional layouts
select 1 2 or 3 dimensions and use the lat and lon as your dimensions
To unsubscribe from this group and stop receiving emails from it, send an email to ORA-google-gro...@googlegroups.com.
To view this discussion on the web visit https://groups.google.com/d/msgid/ORA-google-group/f6e089be-28cc-4d49-9c00-d9af3fac27ado%40googlegroups.com.
Hovig Tchalian
Aug 5, 2020, 10:00:20 PM8/5/20
to ORA-goog...@googlegroups.com
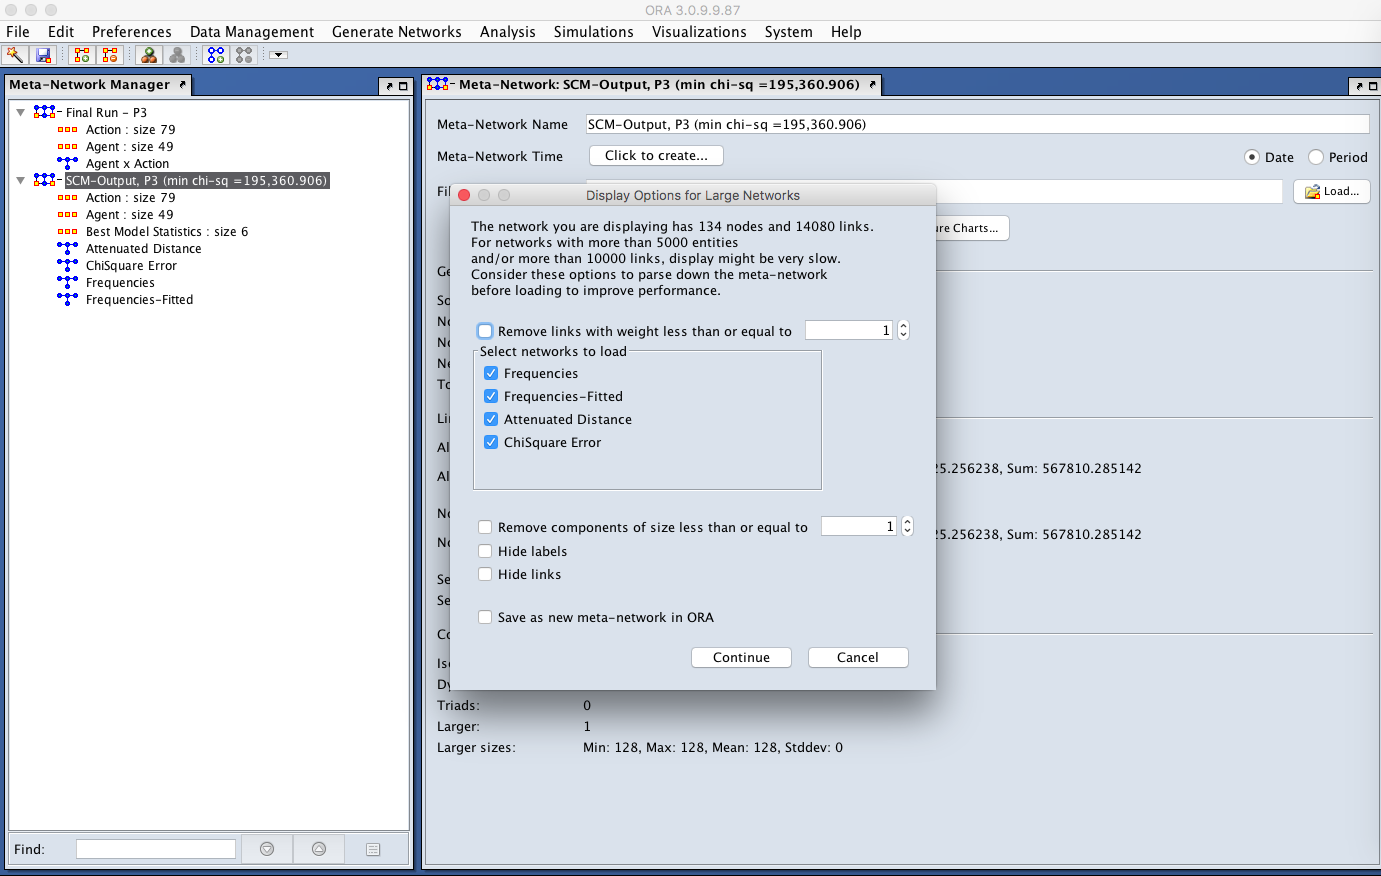
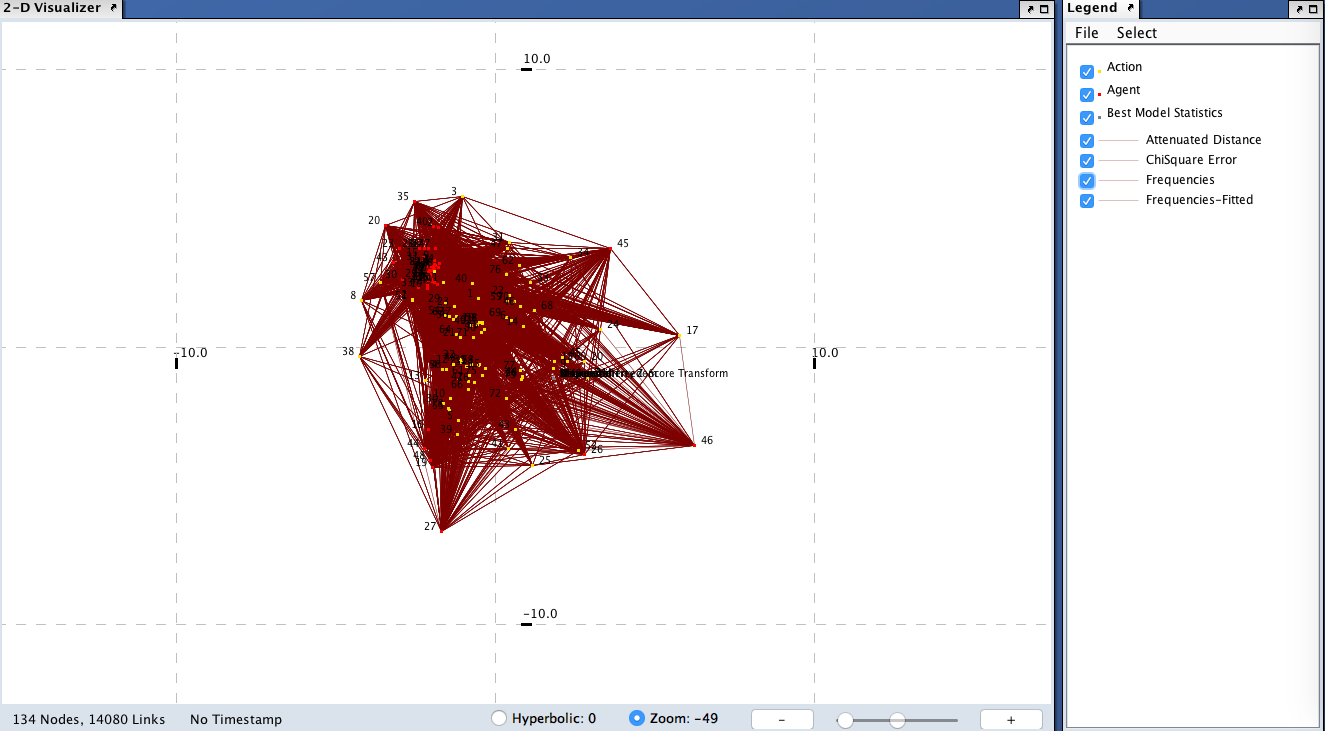
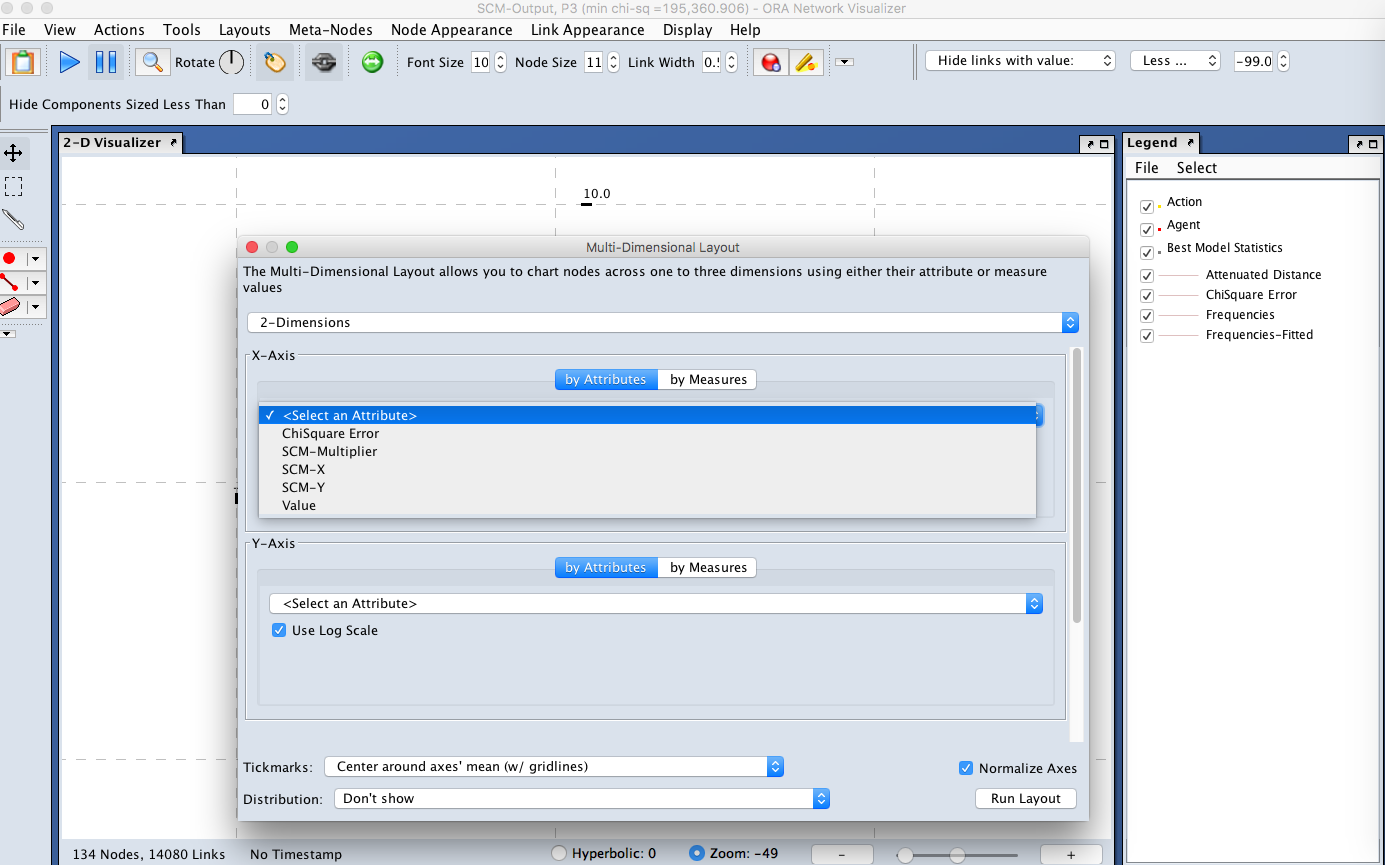
I tried again, and it generated the visualization. I used the metanode for the best-fit model across several runs. Two options I see in the pulldown on the visualization are the SCM-X and SCM-Y, which I presume are the lat and long.
However, I need ORA to visualize the agent x action network. And instead, it generates a map of the measures, even when I uncheck everything but agent and action. Not sure what I need to do to get it to visualize the frequency-based links across the bi-modal matrix represented by the best-fit SCM model I'm inputting.
Attaching relevant screenshots.
To unsubscribe from this group and all its topics, send an email to ORA-google-gro...@googlegroups.com.
To view this discussion on the web visit https://groups.google.com/d/msgid/ORA-google-group/CAFtd-nZ_6H007FyrryyuKXOx4VnsHmy6Q3PgG5ru3mB4SAvZWA%40mail.gmail.com.
hovig.t...@gmail.com
Aug 11, 2020, 9:00:05 PM8/11/20
to ORA Google Group
Any suggestions here?

Jon Storrick
Aug 12, 2020, 9:29:50 AM8/12/20
to ORA-goog...@googlegroups.com
I can't comment on the SCM side of things, but visualization is something I know a thing or two about.
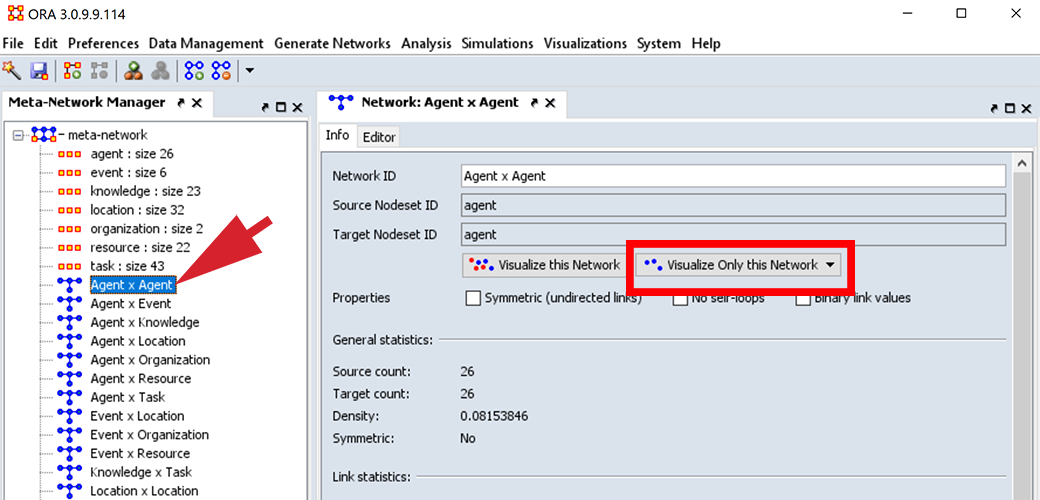
For starters, if there's a single network that you're interested in, you can open only that network in the Visualizer. (See screenshot 1, below) To do so, select the network in the Meta-Network manager (see Arrow) and then click the "Visualize Only this Network" button. This opens up the visualizer with only the links and nodes relevant to that network, nothing else.
You seem to have the hang of the Multi-Dimensional layout tool. As long as you specify SCM-X for the X coordinate and SCM-Y for the Y-coordinate, it'll chart them as you'd expect. Unless you're looking for something different?
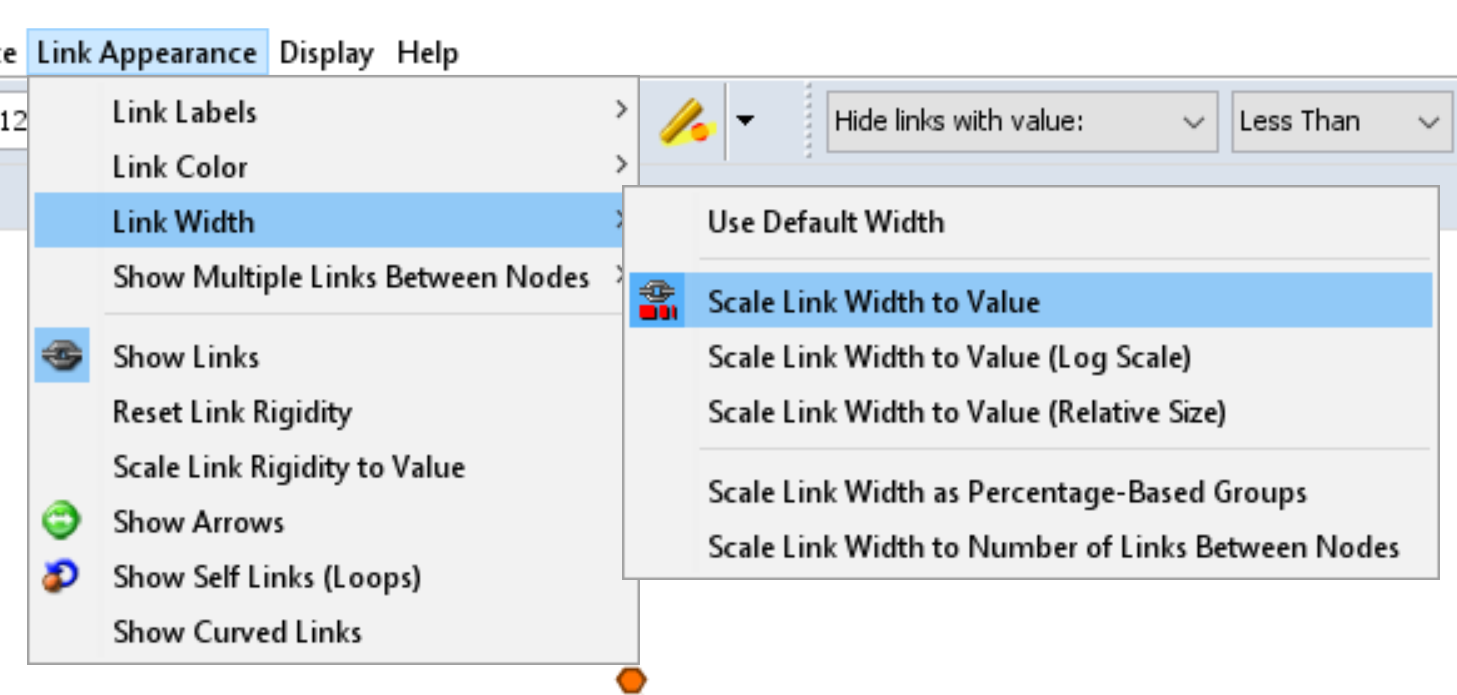
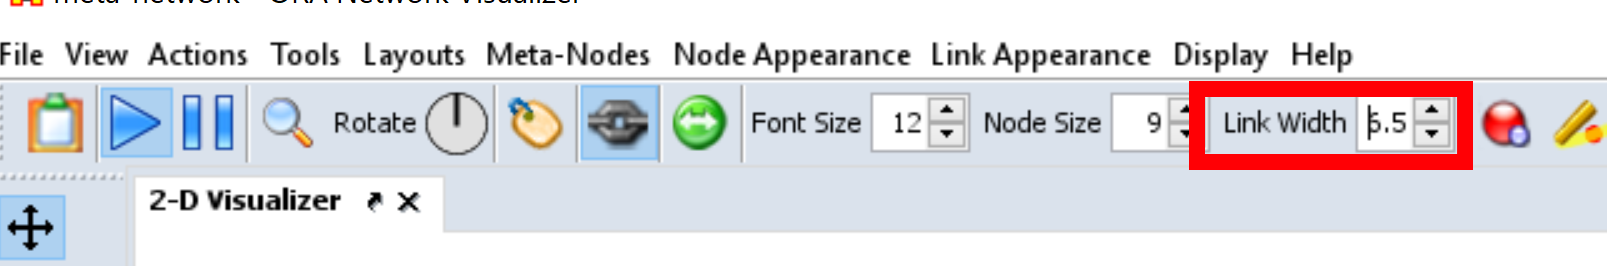
If your network has link strengths/values (which if they're frequency-based, it's likely), you can tell the Visualizer to show you those values. In the visualizer, the option you want is "Link Appearance -> Link Width -> Scale Link Width to Value". This causes the thickness of a link to be proportional to its value. Furthermore, once link values are scaled, you can adjust the scale disparity by using the Link Width spinner in the Visualizer's toolbar.
I hope that helps
(Screenshot 1)
To view this discussion on the web visit https://groups.google.com/d/msgid/ORA-google-group/58dbeb61-846f-42ee-83fe-36b4284e8602n%40googlegroups.com.
Jon Storrick | jon.storrick (at) gmail.com
Hovig Tchalian
Aug 12, 2020, 5:57:17 PM8/12/20
to ORA-goog...@googlegroups.com
Thanks. That's helpful. I can now run only the agent x action network. Thanks for that.
Problem I'm still having is that, once I run SCM and use the meta networks as outputs, the output doesn't show the original labels but the numbers associated with them. Is there a way to show the original agent and action labels?
Screenshot below.
To view this discussion on the web visit https://groups.google.com/d/msgid/ORA-google-group/CADDSmL5TfbNpFLCLsjFtxBKhos3sdVraQNDvEwRAucVtF_H9uA%40mail.gmail.com.
hovig.t...@gmail.com
Aug 14, 2020, 12:36:26 PM8/14/20
to ORA Google Group
Please let me know if you have suggestions about how to align the labels with the excel row and column inputs and, if so, how I can change them in ORA. That should take care of the last step I need to generate the SCM 2D maps.
Thanks again.
Jeff Reminga
Aug 14, 2020, 1:07:25 PM8/14/20
to ORA-goog...@googlegroups.com
Hi Hovig,
I will be looking into and fixing the SCM labeling problem. A fix will be forthcoming and I will keep you posted.
Thanks,
Jeff
ORA Developer
To view this discussion on the web visit https://groups.google.com/d/msgid/ORA-google-group/7e494052-01f8-4d36-8b0d-503bd16d6533n%40googlegroups.com.
Hovig Tchalian
Aug 14, 2020, 2:15:47 PM8/14/20
to ORA-goog...@googlegroups.com
Thanks, Jeff. Much appreciated.
To view this discussion on the web visit https://groups.google.com/d/msgid/ORA-google-group/CACr%2B-gSSFpanRL_m6QW7wXLFVse9r0H%3DhQiy2Bws5VYP0k7ukw%40mail.gmail.com.
Reply all
Reply to author
Forward
0 new messages