Simple, more robust method to assess agreement

Abhaya Indrayan

Sreenivas.V
--
--
To post a new thread to MedStats, send email to MedS...@googlegroups.com .
MedStats' home page is http://groups.google.com/group/MedStats .
Rules: http://groups.google.com/group/MedStats/web/medstats-rules
---
You received this message because you are subscribed to the Google Groups "MedStats" group.
To unsubscribe from this group and stop receiving emails from it, send an email to medstats+u...@googlegroups.com.
To view this discussion on the web, visit https://groups.google.com/d/msgid/medstats/CAP7G4a7uF-0%3D3soSkqpA4fLJHRST3LrcxD91xwa5L9uD8zHHEw%40mail.gmail.com.
Department of Biostatistics
All India Institute of Medical Sciences
New Delhi 110029

Bunce, Catey
I think the problem is with the journals rather than the method.
Best wishes
Catey
--
Abhaya Indrayan
To view this discussion on the web, visit https://groups.google.com/d/msgid/medstats/VE1PR01MB5792130A391702A032706428AEC39%40VE1PR01MB5792.eurprd01.prod.exchangelabs.com.

Thomas Keller
www.acomed-statistik.de
Abhaya Indrayan

Bruce Weaver
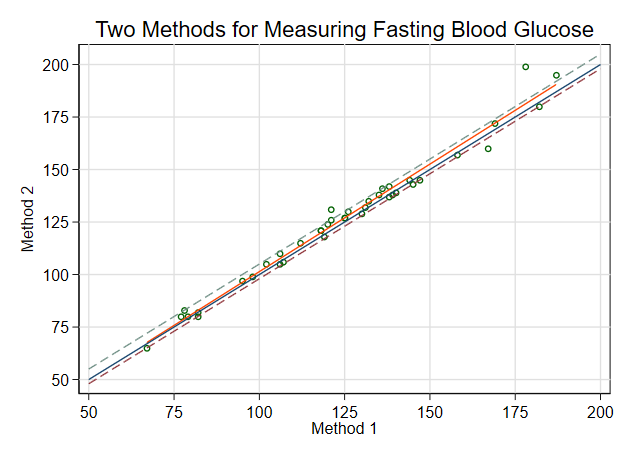
- A scatter-plot that includes both the line of equality (Y=X) and the least squares regression line
- The ICC, Pearson r, and the mean difference, each with its 95% CI

// https://www.preprints.org/manuscript/202108.0343/v1
clear *
input byte id meth1 meth2 diff pcdiff
1 106 110 4 3.77
2 82 80 -2 -2.44
3 121 126 5 4.13
4 95 97 2 2.11
5 178 199 21 11.80
6 147 145 -2 -1.36
7 135 138 3 2.22
8 140 139 -1 -0.71
9 112 115 3 2.68
10 126 130 4 3.17
11 130 129 -1 -0.77
12 106 105 -1 -0.94
13 187 195 8 4.28
14 77 80 3 3.90
15 120 124 4 3.33
16 118 121 3 2.54
17 67 65 -2 -2.99
18 136 141 5 3.68
19 98 99 1 1.02
20 102 105 3 2.94
21 118 121 3 2.54
22 182 180 -2 -1.10
23 167 160 -7 -4.19
24 132 135 3 2.27
25 82 82 0 0.00
26 79 80 1 1.27
27 139 138 -1 -0.72
28 125 127 2 1.60
29 119 118 -1 -0.84
30 78 83 5 6.41
31 131 132 1 0.76
32 145 143 -2 -1.38
33 169 172 3 1.78
34 158 157 -1 -0.63
35 144 145 1 0.69
36 138 137 -1 -0.72
37 121 131 10 8.26
38 107 106 -1 -0.93
39 125 127 2 1.60
40 138 142 4 2.90
end
twoway scatter meth2 meth1, ///
xlab(50(25)200, grid) ylab(50(25)200, grid angle(0)) ///
ms(oh) xtitle(Method 1) ytitle(Method 2) || ///
lfit meth2 meth1 || ///
function y=x, range(50 200) || ///
function y=x-2, range(50 200) lpattern(dash) || ///
function y=x+5, range(50 200) lpattern(dash) legend(off) ///
title(Two Methods for Measuring Fasting Blood Glucose)
generate byte good = inrange(meth2,meth1-2,meth1+5)
* ssc install fre // Uncomment this line to install -fre- command if necessary
fre good
ci proportion good, wilson
ci proportion good if inrange(meth1-meth2,-10,10), wilson
ttest meth2==meth1
corrci meth*
// Reshape to long before using -icc- command
reshape long meth, i(id) j(m)
icc meth id
Abhaya Indrayan
--
--
To post a new thread to MedStats, send email to MedS...@googlegroups.com .
MedStats' home page is http://groups.google.com/group/MedStats .
Rules: http://groups.google.com/group/MedStats/web/medstats-rules
---
You received this message because you are subscribed to the Google Groups "MedStats" group.
To unsubscribe from this group and stop receiving emails from it, send an email to medstats+u...@googlegroups.com.
To view this discussion on the web, visit https://groups.google.com/d/msgid/medstats/7a4c8dec-7e61-4698-bf53-63a47fadb39an%40googlegroups.com.
Bruce Weaver
Abhaya Indrayan
To view this discussion on the web, visit https://groups.google.com/d/msgid/medstats/b8704971-5e73-485e-9e19-ee73546c9442n%40googlegroups.com.
Bunce, Catey
Sometimes less is more.
Best wishes to all
Catey
From: meds...@googlegroups.com <meds...@googlegroups.com>
On Behalf Of Abhaya Indrayan
Sent: 24 August 2021 16:49
To: meds...@googlegroups.com
Subject: Re: {MEDSTATS} Simple, more robust method to assess agreement
OK. Thanks.
On Tue, Aug 24, 2021 at 9:17 PM Bruce Weaver <bwe...@lakeheadu.ca> wrote:
In my earlier post, I failed to mention that -corrci- is a user-written command for Stata (by Nick Cox). Here is the command to install it:
net install pr0041_3.pkg // Install NJC's -corrci- command
On Tuesday, August 24, 2021 at 11:37:05 AM UTC-4 aindrayan wrote:
Thanks to Bruce for his valuable inputs. These will surely help. I will try to incorporate his suggestions with due acknowledgment.
~Abhaya
On Tue, Aug 24, 2021 at 8:58 PM Bruce Weaver <bwe...@lakeheadu.ca> wrote:
For cases like the blood glucose example in Dr. Indrayan's preprint, I like to give readers the following:
- A scatter-plot that includes both the line of equality (Y=X) and the least squares regression line
- The ICC, Pearson r, and the mean difference, each with its 95% CI
It would not be difficult to add two more lines indicating the clinical tolerance limits, and the proportion of data points falling within those limits. I've pasted below some Stata code to do that for Dr. Indrayan's example. Here are the main results. The reddish line in the graph below is the OLS regression line, and the dashed lines show the tolerance limits (-2 and 5). (I didn't take the time to format everything like one would for an article, but I hope it is still understandable.)
To view this discussion on the web, visit https://groups.google.com/d/msgid/medstats/CAP7G4a4UUMCmJrd1j0LSq6Wusqt5ryQQEDVv4Vx1J8K_fQhbDw%40mail.gmail.com.