Problem with assigning experimental runs

Shad Arf
# Set working directory to the current one:
invisible(setwd())
# (1) Load Required
Libraries Here:
RequirLibs <- c("viridisLite","stringr","dplyr","caret",
"Cardinal", "plyr");invisible(lapply(RequirLibs,require, character.only = T))
#
___________________________________________________________________________
# (2) Load file:
selectFile <- file.choose() %>% basename() %>% tools::file_path_sans_ext()
# ___________________________________________________________________________
# (3) Convert to MSI using Cardinal::readImzML
# Convert to MSImagingExperiment _ Function _
ReadMSI <-function(FromFile){
DataSet <- Cardinal::readImzML(FromFile, attach.only = F
) # False for Dense Matrix and working with RAM, True for sparse matrix.
# toMSImagingExp <- as(DataSet, "MSImagingExperiment")
# toMSImagingExp
}
# Convert Data
RawData <- selectFile %>% ReadMSI() %>% invisible # gets RawData, and converts it to MSImaging experiment
# ______________________________________________________________________________
# () Pre-Process FTICR_MSI data:
# Peak Alignment => Normalisation => Filteration
myDat_ref <- function(RawData){
Cardinal::peakAlign(RawData,
tolerance = 0.5, units= "mz",
) %>%
Cardinal::normalize(method="rms") %>% # "tic"
# use mean peak as a reference for alignment, a tolerance and mz as units
Cardinal::peakFilter(freq.min = 0.01, rm.zero = T) %>%
Cardinal::process()
}
pkAlndData <- myDat_ref(RawData = RawData) %>% invisible()
# ______________________________________________________________________________
# pkAlndData_Vectorise <- saveRDS(object = pkAlndData, file = "PreProcessed.RData", compress = TRUE)
# ______________________________________________________________________________
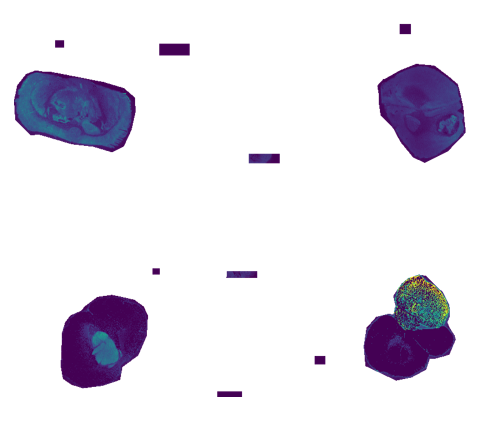
# Make Selections
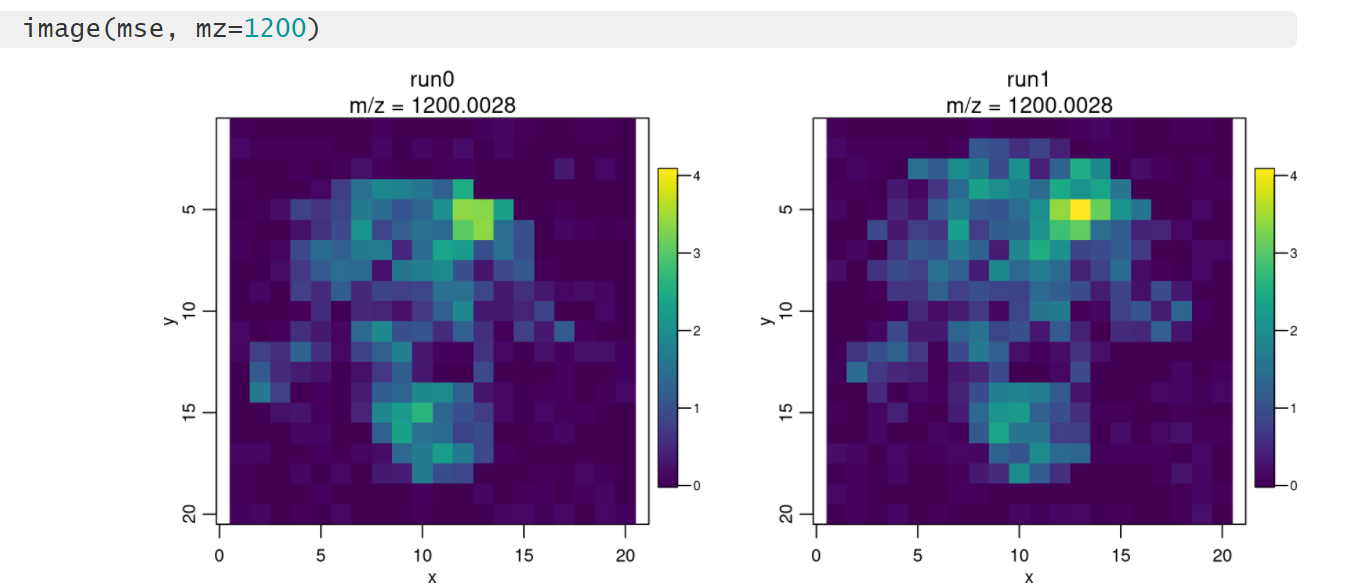
# Run 1
# mt_1 the upper right corner with a cone shaped tumour region
mt_1 <- Cardinal::selectROI(pkAlndData, mz = 300, key = NA,
contrast.enhance="histogram", normalize.image="linear")
# the upper left corner Normal
nmt_1 <- Cardinal::selectROI(pkAlndData, mz = 300, key = NA,
contrast.enhance="histogram", normalize.image="linear")
# Run 2 : lower right corner Tumour
mt_2 <- Cardinal::selectROI(pkAlndData, mz = 300,key = NA,
contrast.enhance="histogram", normalize.image="linear")
# lower left corner (Normal)
nmt_2 <- Cardinal::selectROI(pkAlndData, mz = 300,key = NA,
contrast.enhance="histogram", normalize.image="linear")
# Join Regions, using makeFactor() function:
T_regnz <- Cardinal::makeFactor(Sample1 = mt_1,
Sample2 = nmt_1,
Sample3 = mt_2,
Sample4 = nmt_2)
# define runs below
run(pkAlndData) = T_regnz
# Add Diagnosis classes below:
mt1_slct <- pkAlndData[mt_1]; pData(mt1_slct)$Diagnosis = "mt"
nmt1_slct <- pkAlndData[nmt_1]; pData(nmt1_slct)$Diagnosis = "nmt"
mt2_slct <- pkAlndData[mt_2]; pData(mt2_slct)$Diagnosis = "mt"
nmt2_slct <- pkAlndData[nmt_2]; pData(nmt2_slct)$Diagnosis = "nmt"
# Join regions using cbind() Function.
T_regns_bound <- cbind(mt1_slct, mt1_1_slct,
nmt1_slct, nmt1_1_slct,
mt2_slct, mt2_1_slct,
nmt2_slct, nmt2_1_slct)
# Subset the images based on pixels to include only those pixels that are diagnosed as mt and nmt
Subsetted <- T_regns_bound %>% Cardinal::subsetPixels(!is.na(Diagnosis))
# Proceed to SSC_Cross_Validation

