number of mass features and the resolution of binning
123 views
Skip to first unread message

yonghu...@gmail.com
Feb 11, 2021, 2:45:26 AM2/11/21
to Cardinal MSI Help
Dear Cardinal users,
I am recently working on MSI imaging data generated by rapifleX MALDI TOF. I feel confused by the results I got from my test data. My test data was exported to imzml format using Bruker's Fleximaging V5.0. My Cardinal version is 2.6.0, and my R version is 4.0.2.
Here is my script for data preprocessing:
Brain <- readMSIData(path,
resolution = 50,
units = "ppm",
mass.range = c(500, 1100),
attach.only = T)
Brain <- Brain %>%
normalize(method = "rms") %>%
peakPick(method = "mad", SNR = 6) %>%
peakAlign(tolerance = 50, units = "ppm") %>%
process(BPPARAM = SerialParam())
(1) number of mass features. Whatever resolution and tolerance parameters I set in the script, the number of mass features I got is always 2755.
An object of class 'MSProcessedImagingExperiment'
<2755 feature, 175232 pixel> imaging dataset
imageData(1): intensity
featureData(0):
pixelData(0):
metadata(11): ibd binary type universally unique identifier ... files name
processing complete(3): normalize peakPick peakAlign
processing pending(0):
run(1): Image3
raster dimensions: 544 x 384
coord(2): x = 2019..2562, y = 354..737
mass range: 500.0882 to 1099.9461
centroided: TRUE
(2) Resolution of binning. When I slightly change the binning resolution, e.g., from 100 to 101 ppm, the number of mass features is increased from 2755 to 7803. I don't understand why the number of mass features increased, and the increase is so significant?
resolution(Brain2) <- 101
Brain2
An object of class 'MSProcessedImagingExperiment'
<7803 feature, 175232 pixel> imaging dataset
imageData(1): intensity
featureData(0):
pixelData(0):
metadata(11): ibd binary type universally unique identifier ... files name
processing complete(3): normalize peakPick peakAlign
processing pending(0):
run(1): Image3
raster dimensions: 544 x 384
coord(2): x = 2019..2562, y = 354..737
mass range: 500.0882 to 1099.6931
centroided: TRUE
(3) Dear MALDI TOF users, do you have some recommended parameter settings for MALDI TOF instrument?
Thanks a lot for your help.
Yonghui

Melanie Föll
Feb 11, 2021, 4:01:23 AM2/11/21
to Cardinal MSI Help
Hi Yonghui,
1) setting the resolution in readMSIData works only for processed imzML files not for continuous ones, which you probably have (https://ms-imaging.org/wp/imzml/data-structure/). The number of features will change by modifying the peak picking parameters, especially method and SNR.
2) resolution bins processed imzML files to new m/z resolutions. After peak picking you obtained a processed imzML file with centroided peaks and to my understanding resolution is not intended to be used after peak picking.
3) Parameters really depend on how your data looks like. TIC normalization is more commonly used than RMS. Smoothing with a small window size and baseline reduction are generally recommended. In case you have m/z shifts between your spectra use mzAlign before peak picking. Tolerance for this step and peak align around 100ppm, but again dependent on the m/z shift in your data. I personally prefer the simple peak picking method but then use the obtained m/z list in the peakBin function later. SNR 6 seems ok, I assume for good rapifleX data you could even set it a bit higher, probably max. to 10. Afterwards peakalignment and peakFilter for peaks that occur in at least 1% of spectra. Then use the obtained m/zs in the peakBin function.
HTH,
Melanie
yonghu...@gmail.com
Feb 11, 2021, 5:07:01 AM2/11/21
to Cardinal MSI Help
Dear Melanie,
Many thanks for your kind help, and sorry to bother you again.
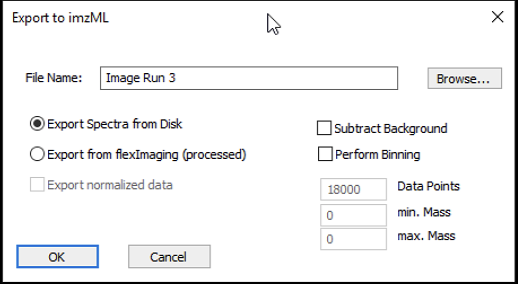
(1) The processed data was exported to imzML format using Bruker’s FlexImaging software (please see figure below). Do you have some recommendations on data export with FlexImaging? e.g., Should I subtract background and perform binning during data export?
I expect the number of mass features to be change when I change the resolution. I don’t understand why it kept the same.
(2) The reason I used resolution binning is that I wanted to check why only a small number of mass features were detected from my dataset. After increasing the resolution, I expect to see a reduction of features, but I saw a 3-fold mass feature increase. This is also what I couldn’t figure out.
(3) As MALDI TOF is not high mass resolution MS, I am not sure it is necessary to use mzAlign() before peak picking.
Thanks a lot again for your help
Yonghui
Melanie Föll
Feb 11, 2021, 10:38:24 AM2/11/21
to Cardinal MSI Help
Hi Yonghui,
1) I would export the raw data from Fleximaging if possible. Only if the file is too large to work with, I would recommend binning during data export.
2) As I said I guess the resolution function does strange things when applied to a centroided file. In case you expect more features it could be that you have to decrease SNR during peak picking. To me 2700 features sounds pretty high, are you sure you are expecting so many peaks?
3) mzAlign can be used with known m/z for recalibration, but what I mean is that it can also align m/z shifts between spectra to the medium spectrum and I absolutely needed it for all low resultion data I analyzed.
Best,
Melanie
yonghu...@gmail.com
Feb 11, 2021, 11:31:40 AM2/11/21
to Cardinal MSI Help
Dear Melanie,
Thanks a lot for your help.
I am used to work with the MSI data generated using Bruker's FTICR and Thermo's Orbitrap. This is my first MSI data acquired by MALDI TOF, and I thought 2700 mass features is quite low. :) Thanks a lot for your help and clarification .
Best regards,
Yonghui
Reply all
Reply to author
Forward
0 new messages