Trigger Snapshot Generation

343 views
Skip to first unread message

David Gutman

unread,
Feb 16, 2014, 3:07:43 PM2/16/14
to xnat_di...@googlegroups.com
I found an old post by Tim that mentioned a way to autotrigger a pipeline via REST--- but this was probably postd in the era of XNAT 1.5.2+-......

I instaled an "ADVANCED REST Client" plugin into my chrome browser and tried posting a blank message to the following URL's... 

Just to be complete I also did both an http and https:// POST and even tried to embed my password...  before I go nuts and try every alternative.. .I wanted to make sure that the XNAT 1.6.2.1 codebase even theoretically still supports this REST request....


http://user:pass@XNAT_SERVER:8080/xnat_vault/DATA/subjects/xnat_vault_S00128/experiments/xnat_vault_E00204?triggerPipelines=true

<html><head><title>Apache Tomcat/7.0.26 - Error report</title><style><!--H1 {font-family:Tahoma,Arial,sans-serif;color:white;background-color:#525D76;font-size:22px;} H2 {font-family:Tahoma,Arial,sans-serif;color:white;background-color:#525D76;font-size:16px;} H3 {font-family:Tahoma,Arial,sans-serif;color:white;background-color:#525D76;font-size:14px;} BODY {font-family:Tahoma,Arial,sans-serif;color:black;background-color:white;} B {font-family:Tahoma,Arial,sans-serif;color:white;background-color:#525D76;} P {font-family:Tahoma,Arial,sans-serif;background:white;color:black;font-size:12px;}A {color : black;}A.name {color : black;}HR {color : #525D76;}--></style> </head><body><h1>HTTP Status 404 - /xnat_vault/DATA/subjects/xnat_vault_S00128/experiments/xnat_vault_E00204</h1><HR size="1" noshade="noshade"><p><b>type</b> Status report</p><p><b>message</b> <u>/xnat_vault/DATA/subjects/xnat_vault_S00128/experiments/xnat_vault_E00204</u></p><p><b>description</b> <u>The requested resource (/xnat_vault/DATA/subjects/xnat_vault_S00128/experiments/xnat_vault_E00204) is not available.</u></p><HR size="1" noshade="noshade"><h3>Apache Tomcat/7.0.26</h3></body></html>


I did check the experiment/subject UID's are actually the appropriate ones...


You can remotely trigger the generation of the snapshots using the following...

http://docs.xnat.org/REST+API+-projects-%28ID%29-subjects-%28ID-label%29-experiments-%28ID-label%29

HOST/REST/projects/{X}/subjects/{X}/experiments/{X}?triggerPipelines=true

Or I think HOST/REST/experiments/{ID}?triggerPipelines=true would work as well.

What URLs are you using to upload the session data?  There may be other helpful commands depending on how you are uploading the data.  Are you uploading one file at a time, or in zip(s)?  This is DICOM right?

Tim


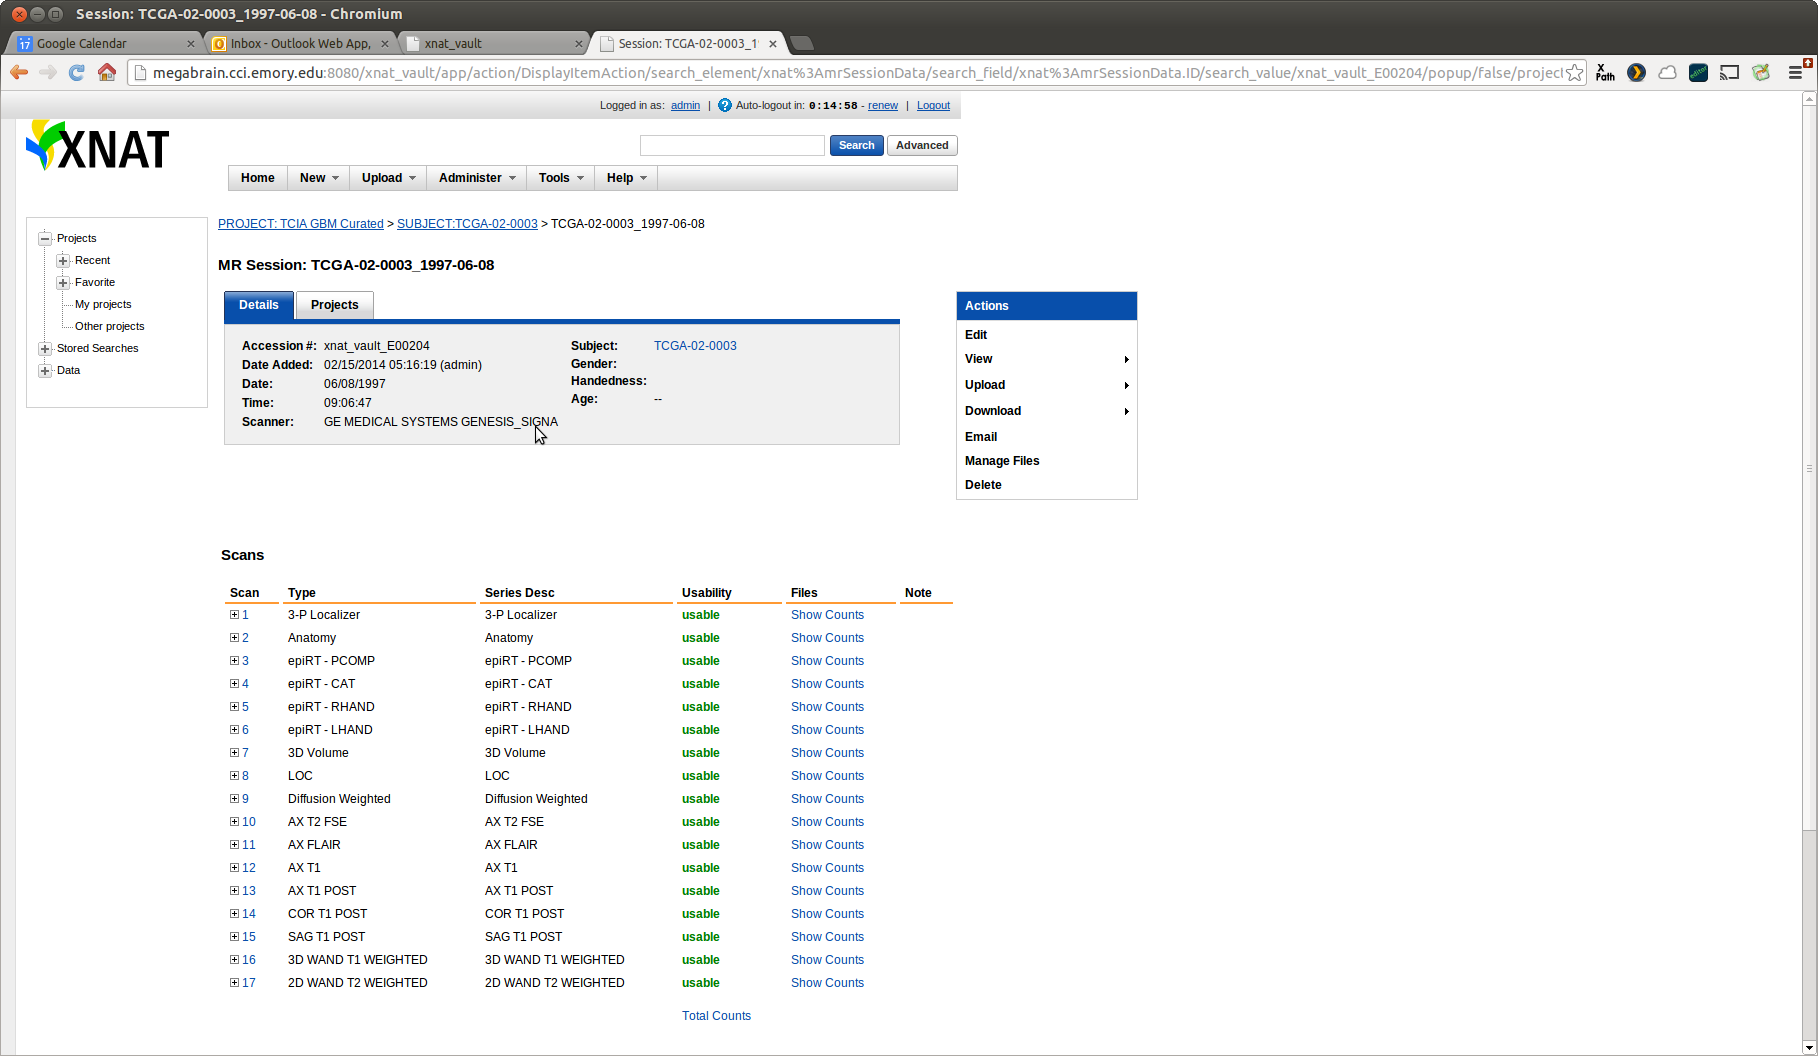
REST/projects/GBM_CURATED/subjects/xnat_vault_S00128/experiments/xnat_vault_E00204?triggerPipelines=true


--
David A Gutman, M.D. Ph.D.
Assistant Professor of Biomedical Informatics
Senior Research Scientist, Center for Comprehensive Informatics
Emory University School of Medicine

Mohana Ramaratnam

unread,
Feb 17, 2014, 2:17:16 AM2/17/14
to xnat_di...@googlegroups.com
Hi david,

The following command generates the snapshots:

PIPELINE_HOME/image-tools/WebBasedQCImageCreator -session XNAT_SESSION_LABEL -project XNAT_PROJECT_ID -xnatId XNAT_SESSION_ACCESSION_NUMBER -host XNAT_HOST -u User_NAME -pwd XNAT_PASSWORD -raw

You could add to your site (as admin), the pipeline PIPELINE_HOME/catalog/images/WebBasedQCImageCreator.xml

Then, as project owner, add the WebBasedQCImageCreator.xml pipeline to your project and launch the pipeline from the Imaging Session Action Box. 

The snapshots will not be generated from compressed dicoms and also for secondary scans and scans which have less than 2 slices. 

Mohana


--
You received this message because you are subscribed to the Google Groups "xnat_discussion" group.
To unsubscribe from this group and stop receiving emails from it, send an email to xnat_discussi...@googlegroups.com.
To post to this group, send email to xnat_di...@googlegroups.com.
Visit this group at http://groups.google.com/group/xnat_discussion.
For more options, visit https://groups.google.com/groups/opt_out.

Tim Olsen

unread,
Feb 17, 2014, 10:03:06 AM2/17/14
to xnat_di...@googlegroups.com

And, yes, doing a PUT to /REST/projects/P/subjects/S/experiments/E?triggerPipelines=true should still be supported.


Tim

David Gutman

unread,
Feb 17, 2014, 10:04:32 AM2/17/14
to xnat_di...@googlegroups.com
aah thanks-- I think I was doing a POST not a PUT...

David Gutman

unread,
Feb 17, 2014, 10:21:29 AM2/17/14
to xnat_di...@googlegroups.com
Do I have to do anything so that the "launch pipeline" shows up as an available action once hte imaging ssession is open?    I added the pipeline and now see it when I browse available pipelines for my project... but when I am actually within the imaging session itself I don't see the box..

Inline image 1

Mohana Ramaratnam

unread,
Feb 17, 2014, 10:23:12 AM2/17/14
to xnat_di...@googlegroups.com

David Gutman

unread,
Feb 17, 2014, 10:31:52 AM2/17/14
to xnat_di...@googlegroups.com
Great--- getting closer--- so the option is now shopping up but when I launched it I got an error...

it says

PipelineScreen_details.vm is not found..

I did a find . -name 'PipelineScreen_details.vm' in my xnat main folder to see if it was simply in a weird location but I couldn't find it at all


"Josh" Dzhoshkun Ismail Shakir

unread,
Oct 19, 2015, 5:11:32 AM10/19/15
to xnat_discussion
Hi all,

We're getting this error as well (more details below). Is there any update on this issue?

We have two XNAT installations: 

(A) on my local machine (Mac OS X Yosemite), simply a test instance

(B) our actual server (CentOS7). 

* On (B) we get the error. On (A) pipelines work fine. 
* I can find the PipelineScreen_details.vm file neither on (A) nor on (B).

Thanks,
Josh

Flavin, John

unread,
Oct 19, 2015, 9:38:46 AM10/19/15
to xnat_discussion
You’ve revived a pretty old thread. Could you give some more detail about what you are trying to do, what steps you have taken to try that, and what outcomes/errors you have seen?

Flavin

For more options, visit https://groups.google.com/d/optout.


The material in this message is private and may contain Protected Healthcare Information (PHI). If you are not the intended recipient, be advised that any unauthorized use, disclosure, copying or the taking of any action in reliance on the contents of this information is strictly prohibited. If you have received this email in error, please immediately notify the sender via telephone or return mail.

"Josh" Dzhoshkun Ismail Shakir

unread,
Oct 19, 2015, 10:36:45 AM10/19/15
to xnat_discussion, fla...@mir.wustl.edu
We have:
(1) cloned the pipeline engine, as described in https://wiki.xnat.org/display/XNAT16/Build+XNAT+from+Source+Repository
(2) configured the pipeline engine, as described in https://wiki.xnat.org/display/XNAT/Pipeline+Engine
(3) installed the WebBasedQCImageCreator pipeline following https://wiki.xnat.org/display/XNAT16/Installing+Pipelines+in+XNAT
(4) activated this pipeline on the server (Administer > Pipelines)

~~

On my local instance:
(1) I issue an HTTP POST to /projects/PROJ_ID/pipelines/WebBasedQCImageCreator/experiments/EXPT_ID
(2) I get an HTTP 200, ie. OK
(3) Pipeline runs, and QC images aka Snapshots are generated (I can view them online).

On our actual server:
steps (1) and (2) above are the same, but no Snapshots are generated.
When I inspect turbine.log, I see:
2015-10-19 09:27:29,371 [http-bio-8080-exec-147] ERROR org.apache.turbine.Turbine - Turbine.handleException:
java.lang.Exception: Could not find screen for PipelineScreen_details.vm
        at org.apache.turbine.modules.screens.VelocityScreen.buildTemplate(VelocityScreen.java:104)
        at org.apache.turbine.modules.screens.TemplateScreen.doBuild(TemplateScreen.java:101)
...

~~

Why we want to issue this REST call:
Our custom uploader software uploads clinical data file-by-file DIRECTLY into archive. Therefore we need to issue the above REST call for running the QC image generation pipeline manually, as opposed to this pipeline being run automatically when a pre-archive dataset is archived.

Flavin, John

unread,
Oct 19, 2015, 11:04:08 AM10/19/15
to xnat_discussion
Thanks, that is helpful. I have a few questions.

1. You say that you get back a 200 status from your XNAT when you launch the pipeline (which indicates to me that, from XNAT’s perspective, it launched the pipeline just fine). If you look at that experiment’s page in your browser, does it show an alert at the top about the pipeline? You may see nothing, or you may see an alert that stays in “Queued” status, or it may show “Failed” status; all of these would indicate different potential problems.

2. In the old thread, there is a quote from Tim saying you can do a PUT to the experiment itself with a query parameter telling it to trigger the automatic pipelines (which is essentially just snapshot generation):
You can remotely trigger the generation of the snapshots using the following
HOST/REST/projects/{X}/subjects/{X}/experiments/{X}?triggerPipelines=true
Or I think HOST/REST/experiments/{ID}?triggerPipelines=true would work as well.
Have you tried that? I don’t know if that would run into the same error or not. Maybe.

3. Is there anything logged into application.log at the time you launched the pipeline? (The pipeline launch would be logged only for fairly recent versions of XNAT, so depending on your version there may be nothing there.) 

4. After you added the pipeline to the XNAT (In Administer > Pipelines) did you add it to your project’s list of pipelines? On the project page there will be a tab for Pipelines; you should add this pipeline to your project there. I don’t think there will be any configuration you would have to do for his pipeline (since it was designed to run without any user input) so you can just click through everything.

"Josh" Dzhoshkun Ismail Shakir

unread,
Oct 20, 2015, 7:25:57 AM10/20/15
to xnat_discussion, fla...@mir.wustl.edu
Thanks for the hints John. Please see my replies below.


On Monday, 19 October 2015 16:04:08 UTC+1, Flavin, John wrote:
Thanks, that is helpful. I have a few questions.

1. You say that you get back a 200 status from your XNAT when you launch the pipeline (which indicates to me that, from XNAT’s perspective, it launched the pipeline just fine). If you look at that experiment’s page in your browser, does it show an alert at the top about the pipeline? You may see nothing, or you may see an alert that stays in “Queued” status, or it may show “Failed” status; all of these would indicate different potential problems.

There's basically no change. Nothing is queued. No failure either.
 

2. In the old thread, there is a quote from Tim saying you can do a PUT to the experiment itself with a query parameter telling it to trigger the automatic pipelines (which is essentially just snapshot generation):
You can remotely trigger the generation of the snapshots using the following
HOST/REST/projects/{X}/subjects/{X}/experiments/{X}?triggerPipelines=true
Now I've tried this. Basically I have:
(a) PUT to /projects/{X}/subjects/{X}/experiments/{X}?triggerPipelines=true
(b) got an HTTP 200 again
(c) this time AutoRun is queued in the experiment view (history), but has been like this for more than 3 hours now.

turbine.log shows me quite a few of this error:
2015-10-20 08:58:17,912 [http-bio-8080-exec-161] ERROR org.apache.turbine.services.velocity.TurbineVelocityService - Class org.nrg.xdat.turbine.utils.TurbineUtils.GetPassedParameter threw Exception
java.lang.NullPointerException
        at org.nrg.xdat.turbine.utils.TurbineUtils.GetPassedParameter(TurbineUtils.java:873)
        at org.nrg.xdat.turbine.utils.TurbineUtils.GetPassedParameter(TurbineUtils.java:817)
        at sun.reflect.GeneratedMethodAccessor193.invoke(Unknown Source)
        at sun.reflect.DelegatingMethodAccessorImpl.invoke(DelegatingMethodAccessorImpl.java:43)
        at java.lang.reflect.Method.invoke(Method.java:483)

* Eventually the PipelineScreen_details.vm exception as well shows up in turbine.log.
 
Or I think HOST/REST/experiments/{ID}?triggerPipelines=true would work as well.

PUT to /experiments/{X}?triggerPipelines=true gives an HTTP 405 Method Not Allowed
 
Have you tried that? I don’t know if that would run into the same error or not. Maybe.

3. Is there anything logged into application.log at the time you launched the pipeline? (The pipeline launch would be logged only for fairly recent versions of XNAT, so depending on your version there may be nothing there.) 

No, at the time of launching the pipeline there's nothing in application.log


4. After you added the pipeline to the XNAT (In Administer > Pipelines) did you add it to your project’s list of pipelines? On the project page there will be a tab for Pipelines; you should add this pipeline to your project there. I don’t think there will be any configuration you would have to do for his pipeline (since it was designed to run without any user input) so you can just click through everything.

Yes, the pipeline is already added in the project as well.

Flavin, John

unread,
Oct 21, 2015, 12:17:36 PM10/21/15
to xnat_discussion
1. I think the PipelineScreen_details.vm errors are unrelated. In my investigation, the only piece of code that attempts to load that non-existent template is some javascript on the project page that renders the pipeline details. As far as I can tell, that code path is not touched when a pipeline is launched. However, I could be wrong, and they could actually be connected. So if you do any more testing and the timestamps of your pipeline launch attempts continue to match those in the turbine.log errors, I’ll have to take another look. But right now I am ignoring the turbine errors.

2. I don’t know what is happening that makes the POST to launch the WebBasedQCImageCreator pipeline fail silently. Can you watch the XNAT logs at the time you try to launch the pipeline to see if anything is logged there about any errors? Because I am really very confused. Even the minimal information from your access.log could help, in that I could see where the POST to launch the pipeline happened, and maybe I could see whether or not anything else happened after that.

3. On a possibly-unrelated-but-possibly-very-related note, I want to investigate the failure of the AutoRun pipeline to launch. Was that launch logged into your application.log? If it was, then we can use that launch string to do further investigations. If it was not, then the next item could provide the same information.

4. I need you to go poke around your ${pipeline_home}/logs directory. Every time the pipeline engine starts, even if it dies immediately after, it will create a log here. When you look, you will have to correlate the timestamps in the file names to when you launched your various pipeline experiments. You should find an entry for the failed-to-launch AutoRun, and that will be useful, but you may also find logs for other pipelines that are of interest. I’m not sure exactly what will be in there because I don’t know if the various job submissions you tried got to this point or not.

Flavin

"Josh" Dzhoshkun Ismail Shakir

unread,
Oct 22, 2015, 5:28:35 AM10/22/15
to xnat_discussion, fla...@mir.wustl.edu


On Wednesday, 21 October 2015 17:17:36 UTC+1, Flavin, John wrote:
1. I think the PipelineScreen_details.vm errors are unrelated.

That is possibly true. Just for the record, these  PipelineScreen_details.vm errors start showing up minutes after the calls are submitted, whereas the actual errors (documented below) appear immediately in the logs.
 
In my investigation, the only piece of code that attempts to load that non-existent template is some javascript on the project page that renders the pipeline details. As far as I can tell, that code path is not touched when a pipeline is launched. However, I could be wrong, and they could actually be connected. So if you do any more testing and the timestamps of your pipeline launch attempts continue to match those in the turbine.log errors, I’ll have to take another look. But right now I am ignoring the turbine errors. 

2. I don’t know what is happening that makes the POST to launch the WebBasedQCImageCreator pipeline fail silently. Can you watch the XNAT logs at the time you try to launch the pipeline to see if anything is logged there about any errors? Because I am really very confused. Even the minimal information from your access.log could help, in that I could see where the POST to launch the pipeline happened, and maybe I could see whether or not anything else happened after that.

I've tried three routes today, watching the logs and the interface each time. Below are the results:

(Route 1) POST to /projects/{X}/pipelines/WebBasedQCImageCreator/experiments/{Y}
=> no change in web interface

=> in ROOT/logs/restlet.log:
[http-bio-8080-exec-205] ERROR org.nrg.xnat.restlet.resources.SecureResource - Pipeline step WebBasedQCImageCreator for project sandbox does not exist


(Route  2) POST to /projects/{X}/pipelines/triggerPipelines/experiments/{Y}

=> in web interface:
AutoRun                 2015-10-22 09:08:08.629 Queued    (still same after about an hour)
Triggered Pipelines 2015-10-22 09:08:06.726 Complete

=> in ROOT/logs/pipeline.log:
Couldnt launch /cs/research/medic/gift-cloud/data/xnat/pipeline/bin/XnatPipelineLauncher -pipeline xnat_tools/AutoRun.xml ...
(cut for brevity)


(Route  3) PUT to /projects/{X}/experiments/{Y}?triggerPipelines=true

=> in web interface:
AutoRun                 2015-10-22 09:00:10.069 Queued    (still same after about an hour)

=> logs same as (Route 2) above


3. On a possibly-unrelated-but-possibly-very-related note, I want to investigate the failure of the AutoRun pipeline to launch. Was that launch logged into your application.log?

No, there is nothing in application.log

 
If it was, then we can use that launch string to do further investigations. If it was not, then the next item could provide the same information.

4. I need you to go poke around your ${pipeline_home}/logs directory. Every time the pipeline engine starts, even if it dies immediately after, it will create a log here. When you look, you will have to correlate the timestamps in the file names to when you launched your various pipeline experiments. You should find an entry for the failed-to-launch AutoRun, and that will be useful, but you may also find logs for other pipelines that are of interest. I’m not sure exactly what will be in there because I don’t know if the various job submissions you tried got to this point or not.

There is no logs directory under ${pipeline_home}, everything related to pipelines seems to be logged in the application's logs (as noted above).

 
...

Flavin, John

unread,
Oct 22, 2015, 9:20:44 AM10/22/15
to xnat_discussion
Route 1
I have a hypothesis. When you added the WebBasedQCImageCreator to your project, did you check the “Run on archive” checkbox? If so, then the name you have to use to launch the pipeline will be different. Try a POST to /projects/{}/pipelines/AUTO_ARCHIVE_WebBasedQCImageCreator/experiments/{}.

Verification: You can check what name XNAT is looking for by looking at the archive spec for your project. Do a GET to (or just open this in your browser) /projects/{}/archive_spec. You’ll see some XML; the root element is arc:project. Follow the tree down to arc:project/arc:pipelines/arc:descendants/arc:descendant[@xsi:type=whatever]/arc:pipeline. I say “xsi:type=whatever” because there may be multiple lists of pipelines for various types, but we don’t care about which is which right now. 

The thing you’re looking for is the “stepId” attribute of the WebBasedQCImageCreator pipeline. If my hypothesis is correct, it will be AUTO_ARCHIVE_WebBasedQCImageCreator. Whatever it is, that is what you should use when you’re doing the POST to launch it. Or, you could edit the settings on the project to uncheck the auto-archive checkbox, and it should just be the name.

Route 2
I can infer the remainder of the pipeline launch string is what you snipped out of the “couldn’t launch” error from the pipeline.log, but was there anything else after that? A stack trace?

The next step in testing this is to run the pipeline manually. You should copy that launch string out of the pipeline.log (everything after “couldn’t launch”), paste it into the command line on your server, run it, and see what errors are produced. Be aware that the username and password in that string will be alias tokens that are only valid for two days, and the password will probably also be obfuscated. So swap in your username and password when you run the command. (The username and password likely won’t affect anything anyway, because clearly the pipeline engine is dying before it can communicate back to XNAT. But still.)

Flavin

"Josh" Dzhoshkun Ismail Shakir

unread,
Oct 23, 2015, 4:02:43 AM10/23/15
to xnat_discussion, fla...@mir.wustl.edu
Thank you for all the insight, Flavin! Indeed helpful. Please see my reply below.


On Thursday, 22 October 2015 14:20:44 UTC+1, Flavin, John wrote:
Route 1
I have a hypothesis. When you added the WebBasedQCImageCreator to your project, did you check the “Run on archive” checkbox? If so, then the name you have to use to launch the pipeline will be different. Try a POST to /projects/{}/pipelines/AUTO_ARCHIVE_WebBasedQCImageCreator/experiments/{}.

Verification: You can check what name XNAT is looking for by looking at the archive spec for your project. Do a GET to (or just open this in your browser) /projects/{}/archive_spec. You’ll see some XML; the root element is arc:project. Follow the tree down to arc:project/arc:pipelines/arc:descendants/arc:descendant[@xsi:type=whatever]/arc:pipeline. I say “xsi:type=whatever” because there may be multiple lists of pipelines for various types, but we don’t care about which is which right now. 

The thing you’re looking for is the “stepId” attribute of the WebBasedQCImageCreator pipeline. If my hypothesis is correct, it will be AUTO_ARCHIVE_WebBasedQCImageCreator. Whatever it is, that is what you should use when you’re doing the POST to launch it. Or, you could edit the settings on the project to uncheck the auto-archive checkbox, and it should just be the name.

=> I've followed these steps. The stepId was AUTO_ARCHIVE_1. When I unchecked "Launch pipeline automatically when session is archived?", then stepId reverted to WebBasedQCImageCreator.

=> A POST to /projects/X/pipelines/WebBasedQCImageCreator/experiments/Y this time resulted in the WebBasedQCImageCreator appearing as queued in the web interface (and staying like that for quite a while), however restlet.log still showed the "Couldn't launch" error with that whole command. And there's no stack trace after that line.

=> When I launched the command manually from a terminal (both with copy-pasting the command directly, and by swapping in the user credentials), I got the following stack trace (again shortened for brevity):

javax.net.ssl.SSLHandshakeException: sun.security.validator.ValidatorException: PKIX path building failed: sun.security.provider.certpath.SunCertPathBuilderException: unable to find valid certification path to requested target
at sun.security.ssl.Alerts.getSSLException(Alerts.java:192)

[...]

Caused by: sun.security.validator.ValidatorException: PKIX path building failed: sun.security.provider.certpath.SunCertPathBuilderException: unable to find valid certification path to requested target
at sun.security.validator.PKIXValidator.doBuild(PKIXValidator.java:387)

[...]

Caused by: sun.security.provider.certpath.SunCertPathBuilderException: unable to find valid certification path to requested target
at sun.security.provider.certpath.SunCertPathBuilder.build(SunCertPathBuilder.java:145)
... 36 more

=> We run Tomcat on port 8080 behind an Apache server. So Apache deals with the encryption (using our self-signed certificate) and forwards all requests to port 8080.

=> With this configuration we are able to run other REST calls (creating subjects, experiments, scans, uploading files) without any problem.

 
...

Tom Doel

unread,
Mar 4, 2016, 10:45:30 AM3/4/16
to xnat_discussion, fla...@mir.wustl.edu

Hi, here's an update (I have been working on this issue with Josh):

After installing a new server certificate the security errors have gone away.

However I can't get the REST call to generate a preview image on our production server. The command to launch the pipeline fails with a generic "Couldnt launch" error (see below in launch.log) and the pipeline is left queued as an active process.

However if I run exactly the same command directly on the server (running as the tomcat user), it succeeds and the preview is generated.

The REST call I am using is (paths etc. redacted with {}):
https://{}/data/projects/{}/pipelines/WebBasedQCImageCreator/experiments/{}

Note this REST call works on one of our test servers, just not on this server.

I've checked the tomcat logs, the ROOT logs and the pipeline logs. The only log files changed after making the REST call are the following:

launch.log
2016-03-04 11:50:48,287 Launching pipeline with command: {}/data/xnat/pipeline/bin/schedule /cs/research/medic/gift-cloud/data/xnat/pipeline/bin/XnatPipelineLauncher -pipeline {}/data/xnat/pipeline/catalog/images/WebBasedQCImageCreator.xml -id {} -host {} -u {} -pwd ******** -dataType xnat:usSessionData -label {} -supressNotification -project "{}" -parameterFile {}/data/xnat/build/{}/{}/archive_trigger/{}/{}/{}_WebBasedQCImageCreator_params_{}.xml -notify {} -notify {} -parameter mailhost='{}' -parameter userfullname='{}' -parameter builddir='{}/data/xnat/build/{}/{}/archive_trigger/{}' -parameter xnatserver='{}' -parameter adminemail='{}' -parameter useremail='{}' -workFlowPrimaryKey {} 

pipeline.log
2016-03-04 11:50:48,298  Couldnt launch {}/data/xnat/pipeline/bin/schedule {}/data/xnat/pipeline/bin/XnatPipelineLauncher -pipeline {}/data/xnat/pipeline/catalog/images/WebBasedQCImageCreator.xml -id {} -host {} -u {} -pwd {} -dataType xnat:usSessionData -label {} -supressNotification -project "{}" -parameterFile {}/xnat/build/{}/{}/archive_trigger/{}/{}/{}_WebBasedQCImageCreator_params_{}.xml -notify {} -notify {} -parameter mailhost='{}' -parameter userfullname='{}' -parameter builddir='{}/data/xnat/build/{}/{}/archive_trigger/{}' -parameter xnatserver='{}' -parameter adminemail='d{}' -parameter useremail='{}' -workFlowPrimaryKey {}

access.log:

localhost_access_log
0:0:0:0:0:0:0:1 - - [04/Mar/2016:11:50:48 +0000] "POST /data/archive/projects/{}/pipelines/WebBasedQCImageCreator/experiments/{} HTTP/1.1" 401 312
0:0:0:0:0:0:0:1 - - [04/Mar/2016:11:50:48 +0000] "POST /data/archive/projects/{}/pipelines/WebBasedQCImageCreator/experiments/{} HTTP/1.1" 200 -

Note the REST call does not generate any new entries in pipeline/logs

If I run the following command (identical to that above) on the server then it succeeds and generates the preview image instantly
{}/data/xnat/pipeline/bin/schedule {}/data/xnat/pipeline/bin/XnatPipelineLauncher -pipeline {}/data/xnat/pipeline/catalog/images/WebBasedQCImageCreator.xml -id {} -host {} -u {} -pwd {} -dataType xnat:usSessionData -label {} -supressNotification -project "{}" -parameterFile {}/xnat/build/{}/{}/archive_trigger/{}/{}/{}_WebBasedQCImageCreator_params_{}.xml -notify {} -notify {} -parameter mailhost='{}' -parameter userfullname='{}' -parameter builddir='{}/data/xnat/build/{}/{}/archive_trigger/{}' -parameter xnatserver='{}' -parameter adminemail='d{}' -parameter useremail='{}' -workFlowPrimaryKey {} 

NB I don't know why the REST call generated two entries in the localhost_access_log but I suspect thats not relevant - it seems the server is trying to execute the correct command to run the pipeline but for some reason that command fails to execute.

Any ideas?

Thanks for your help,
Tom


...

John Flavin

unread,
Mar 4, 2016, 11:31:22 AM3/4/16
to xnat_discussion
Glad to hear you’ve made some progress. The problem you’re seeing does seem bizarre. A couple things come to mind that you could try.

I want to make sure you’re finding all the pipeline logs. There are a lot of them in different places. (Pardon me if I’m being overly careful. I’ve been working with pipelines for years and parts of the system still confuse me sometimes.)

In your pipeline home (which I gather on your server is something like {snip}/data/xnat/pipeline/) there should be a log4j.properties. In that file is a field log4j.appender.nrgAppender.File with a value like /path/to/pipeline.log. Make sure you’re checking that directory for logs. The engine creates a new one each time it starts. (Again, sorry if you’re already looking there. I just want to make sure.)

Oh! In fact, if you could change the logging level in that log4j.properties file to DEBUG (I think the default is WARN) you should get more output when you run pipelines. Should be the first properties. log4j.rootLogger=debug, nrgAppender or something like that.

The second thought I had is to change how you’re launching the pipeline. You’re doing
POST /data/projects/{}/pipelines/WebBasedQCImageCreator/experiments/{}
But, of course, that’s not how snapshots are typically generated. In the typical XNAT workflow, the AutoRun pipeline generates the snapshots; the WebBasedQCImageCreator pipeline is there as sort of a backup in case the snapshots need to be regenerated. So let’s try triggering AutoRun directly and see what happens. I believe if you do a
PUT /data/experiments/{ID}?triggerPipelines=true
or, if you don’t have the experiment ID, a
PUT /data/projects/{}/experiments/{label}?triggerPipelines=true
that will kick off the AutoRun. So you could give that a try.

Flavin
CNDA Pipelines Developer

Tom Doel

unread,
Mar 4, 2016, 1:59:06 PM3/4/16
to xnat_discussion
Hi John,

Thanks for your reply. I'm new to pipelines so I'm very happy to hear any suggestions!

I checked the log4j.properties file and the first line is log4j.rootLogger=debug, nrgAppender so it seems the logging level is already set to debug.

The log4j.appender.nrgAppender.File property points to {snip}/data/xnat/pipeline/logs which has which has log files for the pipelines. When I run a pipeline directly on the server then a new entry is added to the current log, but invoking the REST call does not add anything to the logs.

I tried both of
PUT /data/experiments/{ID}?triggerPipelines=true 
PUT /data/projects/{}/experiments/{label}?triggerPipelines=true 
but these both give HTTP 405 Method Not Allowed

But if I do 
PUT /data/projects/{}/subjects/{}/experiments/{label}?triggerPipelines=true 
 
Then this works, but has a similar effect as the other REST call; the following error appears in pipeline.log;

Couldnt launch {}/data/xnat/pipeline/bin/XnatPipelineLauncher -pipeline xnat_tools/AutoRun.xml -id {} -host {} -u {} -pwd {} -dataType xnat:usSessionData -label {} -supressNotification -project "{}" -notify {} -notify {} -parameter xnat_project='{}' -parameter userfullname='{}' -parameter supressEmail='false' -parameter useremail='{}' -parameter session='{}' -parameter xnatserver='{}' -parameter mailhost='{}' -parameter sessionType='xnat:usSessionData' -parameter adminemail='{}' -parameter sessionLabel='{}' -workFlowPrimaryKey {}

And as with the above command, if I run the same command on the server, then it works and the preview image is generated (and output appears in the pipeline log folder).


The thing that is really odd to me is that the command written in the pipeline.log is correct, which suggests that the REST call, security, data types etc are all correct, it's just something about how XNAT executes that command that causes it to fail when invoked from the REST call instead of from the server command line. Could it be something to do with the interpretation of special characters?

Thanks,
Tom

...

Tom Doel

unread,
Mar 9, 2016, 7:11:53 AM3/9/16
to xnat_discussion
To clarify what happens with the logs:

If I launch the pipeline from a REST call (either method discussed above), OR if I trigger the pipeline from an action menu via the web interface, then:
  • The pipeline does not run but is listed as queued
  • The command appears in `launch.log` in my web app folder 
  •  `Couldnt launch` error appears in `pipeline.log` in my web app folder
  • Nothing appears in the `pipeline/logs` folder
If I launch the same command from the terminal  then:
  • The pipeline runs successfully
  • The command appears in `launch.log` in my web app folder 
  • Nothing appears in `pipeline.log` in my web app folder
  • Pipeline (debug level) output appears in the file `pipeline/logs/pipeline.log.YYYY-MM-DD`

Herrick, Rick

unread,
Mar 9, 2016, 9:45:20 AM3/9/16
to xnat_di...@googlegroups.com
Tom,

The last thing I can think of here is a permissions issue. Can you try running the pipeline script as the Tomcat user? You can do something like:

sudo su – tomcat /data/xnat/pipeline/bin/schedule…

For tomcat, substitute your tomcat user, which may be tomcat or may be tomcat7 or may be xnat or whatever. For the /data/xnat… etc, use the appropriate path to your pipeline folder.

-- 

Rick Herrick

Sr. Programmer/Analyst

Neuroinformatics Research Group

Washington University School of Medicine

(314) 362-1882


From: "xnat_di...@googlegroups.com" <xnat_di...@googlegroups.com> on behalf of Tom Doel <tom...@gmail.com>
Reply-To: "xnat_di...@googlegroups.com" <xnat_di...@googlegroups.com>
Date: Wednesday, March 9, 2016 at 6:11 AM
To: "xnat_di...@googlegroups.com" <xnat_di...@googlegroups.com>
Subject: Re: [XNAT Discussion] Trigger Snapshot Generation

--
You received this message because you are subscribed to the Google Groups "xnat_discussion" group.
To unsubscribe from this group and stop receiving emails from it, send an email to xnat_discussi...@googlegroups.com.
To post to this group, send email to xnat_di...@googlegroups.com.


The materials in this message are private and may contain Protected Healthcare Information or other information of a sensitive nature. If you are not the intended recipient, be advised that any unauthorized use, disclosure, copying or the taking of any action in reliance on the contents of this information is strictly prohibited. If you have received this email in error, please immediately notify the sender via telephone or return mail.

Tom Doel

unread,
Mar 9, 2016, 12:42:19 PM3/9/16
to xnat_discussion
Hi Rick,

The pipeline runs successfully with

sudo su - tomcat -s /bin/sh -c "[..]/pipeline/bin/schedule ..."

which I believe is similar to how XNAT runs the pipeline.

Looking at the XNAT code, the point of failure when making a rest call appears to be in ProcessLauncher.run() (called from XnatPipelineLauncher) in the following lines:

proc = Runtime.getRuntime().exec(cmdArray);
...
int exitValue = proc.waitFor();

where cmdArray is {"/bin/sh", "-c", command}, and command is the call to schedule with the pipeline parameters as written out to launch.log. 

The non-zero return value from the sh call triggers the error.

So now I'm down to guessing why executing the command via a Java Runtime.getRuntime().exec() call fails but executing it on the terminal (for the same user) succeeds

Thanks
Tom

John Flavin

unread,
Mar 9, 2016, 1:39:52 PM3/9/16
to xnat_discussion
I tried to poke around for why this might be happening. Sadly, I have not yet found anything useful. 

But I did find something of historical interest: an article that looks to me like it almost certainly provided the template for the org.nrg.pipeline.ProcessLauncher class http://www.javaworld.com/article/2071275/core-java/when-runtime-exec---won-t.html (especially page 2). Names of the fields are mostly identical, the comments are largely intact, and the StreamGobbler class is spot on 💯.

Flavin

Dzhoshkun Ismail Shakir

unread,
Mar 10, 2016, 4:07:05 AM3/10/16
to xnat_di...@googlegroups.com
Hi all,

Please see my comments below.

On 9 March 2016 at 18:39, John Flavin <fla...@gmail.com> wrote:
I tried to poke around for why this might be happening. Sadly, I have not yet found anything useful. 

But I did find something of historical interest: an article that looks to me like it almost certainly provided the template for the org.nrg.pipeline.ProcessLauncher class http://www.javaworld.com/article/2071275/core-java/when-runtime-exec---won-t.html (especially page 2). Names of the fields are mostly identical, the comments are largely intact, and the StreamGobbler class is spot on 💯.


I've taken a look at this link, and if I understand it correctly, it says that Java Runtime exec() is not a substitute for the command line. Our working XNAT (test) instance is on an Ubuntu 1404, while the failing one (production server) is on CentOS 7. The article also mentions that exec() is not cross-platform. But would it differ even between different Linux flavours ?
 
Flavin

On Mar 9, 2016, at 11:42 AM, Tom Doel <tom...@gmail.com> wrote:

Hi Rick,

The pipeline runs successfully with

sudo su - tomcat -s /bin/sh -c "[..]/pipeline/bin/schedule ..."

which I believe is similar to how XNAT runs the pipeline.
Probably with the difference that no root access is needed: the XNAT instance runs as a Tomcat app under the tomcat user (Rick/Flavin: please correct me in case what I'm saying is wrong). The directories it operates on belong to tomcat (both user and group).

There's however something that bothers me. On our test server (where the REST call works for the xnat instance, Ubuntu 1404), the directories relevant to the pipeline (e.g. the one specified by -parameter builddir= ) have the permissions set as drwxr-xr-x, while on our production xnat instance (where the REST call does NOT work, CentOS 7) the same directories are drwxr-sr-x (note the setgid flag!). Why would a directory be created with the setgid flag set on one instance and not on the other ?

John Flavin

unread,
Mar 10, 2016, 10:21:55 AM3/10/16
to xnat_discussion
I think the guideline that "Runtime.exec() is not a substitute for the command line” is generally good practice, but doesn’t apply in this case. This class (org.nrg.pipeline.ProcessLauncher) is calling Runtime.exec() in a very narrow way that I think should work every time. It is trying to execute {“/bin/sh”, “-c”,  "all-the-stuff-you-actually-want-to-run”}; I would expect that to work across any non-windows os. Unless there is some problem with your /bin/sh, which seems unlikely.

You are correct that XNAT runs everything as the tomcat user (if that’s how you set it up—it could run everything as some other user), and the pipeline process that it spawns will also run as that user. (The “sudo su - tomcat <stuff>” command is just intended to run stuff as the tomcat user while being logged in as a different user. You could also do “sudo su - tomcat” on its own to change yourself to the tomcat user, and then execute whatever commands you like.) For that reason, I don’t think the setgid bit would make a difference. The same user is creating the build directory and the params file, and then executing the pipeline process; that user has owner permissions on anything it creates, so whatever permissions the group has are irrelevant.

What bothers me about this is the lack of logging. The ProcessLauncher creates those StreamGobblers, but seemingly never does anything with them. Their contents aren’t written to a file or logged or even checked as far as I can tell. So if there is some error, we won’t know what it is unless we patch that class to dump the logs somewhere.

Flavin

Herrick, Rick

unread,
Mar 10, 2016, 10:25:41 AM3/10/16
to xnat_di...@googlegroups.com
Another possibility, if we’re getting into patching classes, is to add the -x flag to the start-up arguments for sh. That should let echo exactly what is getting run in the shell command in case something weird is happening with pattern or argument expansion or some kind of voodoo like that.

-- 

Rick Herrick

Sr. Programmer/Analyst

Neuroinformatics Research Group

Washington University School of Medicine

(314) 362-1882

Tom Doel

unread,
Mar 14, 2016, 9:08:35 AM3/14/16
to xnat_discussion
I compiled a basic Java program using the ProcessLauncher and StreamGobbler code, in order to run the snapshot generation using Runtime.getRuntime().exec() exactly as the pipeline engine does. It works fine and generates the thumbnails. And yet the same commands fail when run by XNAT.

I ran it as a standard tomcat user (using 'runner'). So it does not appear to be a problem with user permissions either. 

I'm struggling to think of any way to investigate further, short of recompiling the xnat code with logging added to the StreamGobbler class. I think this can be done with setFile() calls to the StreamGobblers but I'm not too keen to be messing with the production server (and as I said, the problem doesn't occur on our test server).

Any further ideas? We appreciate the time you have put into considering this.

Thanks,

Tom

Tom Doel

unread,
Mar 14, 2016, 9:10:35 AM3/14/16
to xnat_discussion
Sorry, bad autocorrect. Should be "I ran it as a standard tomcat user (using 'runuser')"
Tom

Mohana

unread,
Mar 15, 2016, 7:11:18 AM3/15/16
to xnat_discussion
By any chance - is the tomcat log directory (or the temp space that tomcat uses) full? 

Checklist of things to look for:

a) Tomcat User permissions to pipeline logs directory, PIPELINE_HOME/bin, build dir (tomcat user should have complete permissions)

b) Does tomcat user have a home folder?

c) Tomcat temp space directory is not full


Mohana

Tom Doel

unread,
Mar 23, 2016, 3:03:42 PM3/23/16
to xnat_discussion
Good news, we finally solved this issue. It turned out to be a bad configuration line in our `tomcat.conf` file.

The path was being appended to using syntax of the form `PATH=$PATH:...`. I'm not sure where we got this idea from but it's not correct as `$PATH` is not dereferenced in this context so it is interpreted literally as a string. 

The resulting bad path was cascaded down to the pipeline engine. It's worth noting (in case anyone else has similar issues) that because of the way XNAT calls `exec()` without an environment argument, and similarly the call `/bin/sh -c "foo"'`, the environment (including paths) are inherited from the parent tomcat instance and do not get default values for that user. So if anything in the tomcat messes up the path, that will also affect any pipelines that are run.

Thanks for your help and advice- Mohana, Rick, Flavin and everyone else :)

Tom

John Flavin

unread,
Mar 24, 2016, 9:08:22 AM3/24/16
to xnat_discussion
Very happy to hear you figured out the problem.

Flavin

Reply all
Reply to author
Forward
0 new messages