show map on grid view
88 views
Skip to first unread message

黄祥
May 28, 2016, 1:47:52 AM5/28/16
to web2py-users
let say i have a table definition with latitude and longitude as double, and want to show it in SQLFORM.grid view. is it possible to achieve it using web2py?
i've tested it before and an error occured said :
e.g.
Traceback (most recent call last):
  File "/Users/MacBookPro/site/web2py/gluon/restricted.py", line 227, in restricted
    exec ccode in environment
  File "/Users/MacBookPro/site/web2py/applications/op/views/report/report_check_point.html", line 77, in <module>
NameError: name 'row' is not defined
e.g.
views/report/report_check_point.html
{{extend 'layout.html'}}
{{=grid}}
<style>
#map {
width: 500px;
height: 400px;
}
</style>
<div id="map"></div>
<script>
function initMap() {
var mapDiv = document.getElementById('map');
var latlon = new google.maps.LatLng( {{=row.id.lat}}, {{=row.id.lon}} );
var mapOptions = {
center: latlon,
zoom: 15
};
var map = new google.maps.Map(mapDiv, mapOptions);
var marker = new google.maps.Marker({
position: latlon,
map: map
});
}
</script>
<script src="https://maps.googleapis.com/maps/api/js?callback=initMap" async defer></script>
thanks and best regards,
stifan
黄祥
May 31, 2016, 9:02:26 AM5/31/16
to web2py-users
testing to put it on the SQLFORM.grid links no error occured but the result is not expected
e.g.
controllers
def check_point_admin(row):
scr0 = SCRIPT("""
function initMap() {
var mapDiv = document.getElementById(%s);
var latlon = new google.maps.LatLng( %s, %s );
var mapOptions = {
center: latlon,
zoom: 15
};
var map = new google.maps.Map(mapDiv, mapOptions);
var marker = new google.maps.Marker({
position: latlon,
map: map
});
}
""" % (row.id, row.lat, row.lon)
)
scr1 = SCRIPT(
)
return DIV(_id = row.id), scr0, scr1
def report_check_point():
table = db.check_point
links = [dict(header = T('Image'),
body = lambda row: check_point_admin(row)
)
]
grid = SQLFORM.smartgrid(table, links = links)
return locals()
any idea how to achieve it on web2py?

Massimo Di Pierro
Jun 4, 2016, 11:54:01 AM6/4/16
to web2py-users

Mirek Zvolský
Jun 16, 2016, 9:14:45 AM6/16/16
to web2py-users
I cannot see/download screen shots, is it just my problem?
Dne neděle 5. června 2016 0:06:15 UTC+2 黄祥 napsal(a):

Manuele Pesenti
Jun 17, 2016, 2:50:43 AM6/17/16
to web...@googlegroups.com
Il 05/06/16 00:06, 黄祥 ha scritto:
what about introducing some code like that in your SQLFORM.grid object...
assuming your coordinates are stored in columns lat and lng of your table...
scriptbody = """
function initMap() {
var myLatLng = {lat: %(lat)s, lng: %(lng)s};
var map = new
google.maps.Map(document.getElementById('map_%(id)s'), {
zoom: 4,
center: myLatLng
});
var marker = new google.maps.Marker({
position: myLatLng,
map: map,
title: 'Hello World!'
});
}
""" % r
grid = SQLFORM.grid(....
links = [dict(header="Map", body=lambda r: SPAN(DIV(_id="map_%(id)s"
% r, _style="width: 100%; height: 100%"), SCRIPT(scriptbody,
_type="text/javascript")))],
)
some useful reference documentation:
1)
http://www.web2py.com/books/default/chapter/29/07/forms-and-validators#Virtual-fields-in-SQLFORMgrid-and-smartgrid
2)
https://developers.google.com/maps/documentation/javascript/examples/marker-simple
Cheers
Manuele
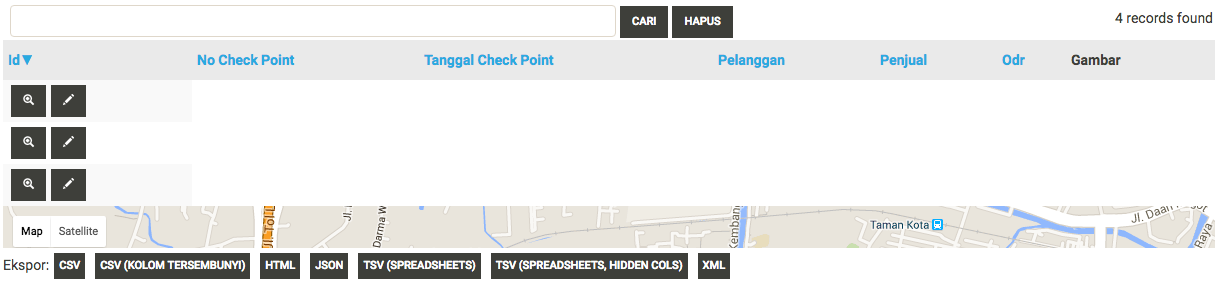
> what i want to achieve is showing a map in each row of
> SQLFORM.smartgrid links (looks like in the attached file)
> thanks massimo, tried your suggestion, but got the same result. any
> idea or suggestion to achieve it in web2py?
>
Hi Stifan,
> SQLFORM.smartgrid links (looks like in the attached file)
> thanks massimo, tried your suggestion, but got the same result. any
> idea or suggestion to achieve it in web2py?
>
what about introducing some code like that in your SQLFORM.grid object...
assuming your coordinates are stored in columns lat and lng of your table...
scriptbody = """
function initMap() {
var myLatLng = {lat: %(lat)s, lng: %(lng)s};
var map = new
google.maps.Map(document.getElementById('map_%(id)s'), {
zoom: 4,
center: myLatLng
});
var marker = new google.maps.Marker({
map: map,
title: 'Hello World!'
});
}
""" % r
grid = SQLFORM.grid(....
links = [dict(header="Map", body=lambda r: SPAN(DIV(_id="map_%(id)s"
% r, _style="width: 100%; height: 100%"), SCRIPT(scriptbody,
_type="text/javascript")))],
)
some useful reference documentation:
1)
http://www.web2py.com/books/default/chapter/29/07/forms-and-validators#Virtual-fields-in-SQLFORMgrid-and-smartgrid
2)
https://developers.google.com/maps/documentation/javascript/examples/marker-simple
Cheers
Manuele
黄祥
Jun 17, 2016, 10:21:09 AM6/17/16
to web2py-users
thanks manuele, i've tried that but the result is same (no error occured but the result is not expected, google maps show almost take the sqlform grid view entirely).
e.g.
def check_point_admin(row):
scr0 = SCRIPT("""
function initMap() {
var mapDiv = document.getElementById(%s);
document.getElementById(%s).setAttribute("style","width:10px");
document.getElementById(%s).setAttribute("style","height:10px");
document.getElementById(%s).style.width='10px';
document.getElementById(%s).style.height='10px';
var latlon = new google.maps.LatLng( %s, %s );
var mapOptions = {
center: latlon,
zoom: 15
};
var map = new google.maps.Map(mapDiv, mapOptions);
var marker = new google.maps.Marker({
position: latlon,
map: map
});
}
#return DIV(_id = row.id, _style="width: 1%; height: 1%"), scr0, scr1
#return DIV(DIV(_id = row.id, _style="width: 1%; height: 1%"), scr0, scr1)def report_check_point():
table = db.check_point
links = [dict(header = T('Image'),
body = lambda row: check_point_admin(row)
)
]
grid = SQLFORM.smartgrid(table, links = links)
return locals()
tried both suggestions (you and massimo) got the same result, i even set the style width & height on the SCRIPT(), but got the same result
tried both suggestions (you and massimo) got the same result, i even set the style width & height on the SCRIPT(), but got the same result
Reply all
Reply to author
Forward
0 new messages