histograms
46 views
Skip to first unread message

Haim Edri
Feb 15, 2017, 6:27:23 AM2/15/17
to VPython-users
Hi
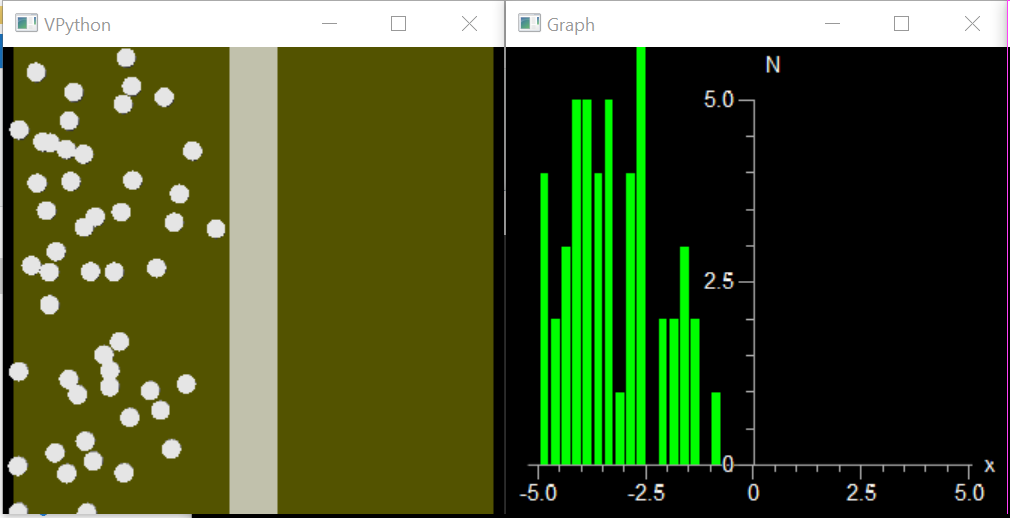
I would like to create density histogram for MD simulation. I can create histogram for the number of particle distribution from a list that contains the particles' positions, but cannot simply convert N(x,t) to rho(x,t) - the local density, since "ghistogram" counts how many particles are in each bin (the position interval).
Is there a way to convert the values of "y axis" of ghistogram? (ideally, I would just divide it by constant - the area of the bins)
Thanks
Haim Edri
(Weizmann Inst. Rehovot, Israel)

Bruce Sherwood
Feb 15, 2017, 7:25:01 AM2/15/17
to VPython-users
I can't think of a way to do this in Classic VPython. In GlowScript VPython and Jupyter VPython you can replace the heights of a gvbars object named "g" by rewriting g.data, which is what is done in this program:
There is no ghistogram option, but the ability to rewrite existing gvbars provides generality.

bash...@ncsu.edu
Feb 15, 2017, 7:31:54 AM2/15/17
to VPython-users
Note that the Classic VPython graph module is written in pure Python and is found at PythonXY/Lib/site-packages/visual_common/graph.py. You could make a copy of this and modify it to suit your needs, and include that module as part of your package.
Reply all
Reply to author
Forward
0 new messages