Property access time in JavaScript programs
34 views
Skip to first unread message

dmonji
Sep 18, 2015, 6:56:19 AM9/18/15
to v8-users
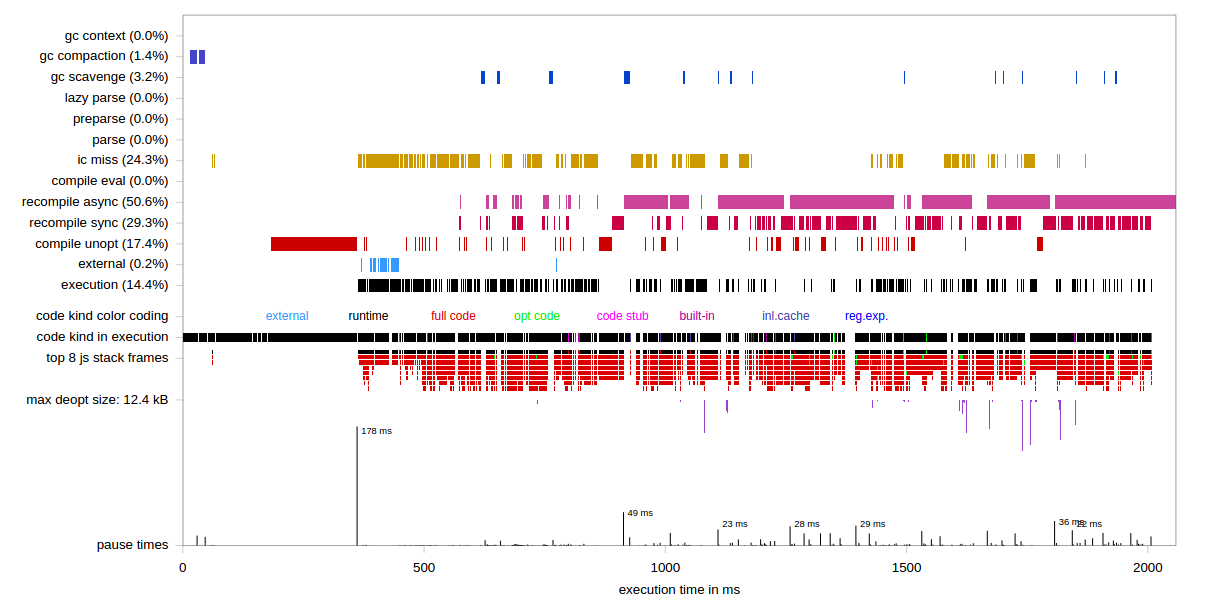
I want to compute the proportion of time spent on property accesses in JavaScript programs. I am aware of
But it is not clear what exactly does "execution" refer to since "ic cache" is shown seperately?
Does "execution" only include "Access time of properties"?

Jakob Kummerow
Sep 18, 2015, 7:00:42 AM9/18/15
to v8-users
Property access time is not measured separately.
--
--
v8-users mailing list
v8-u...@googlegroups.com
http://groups.google.com/group/v8-users
---
You received this message because you are subscribed to the Google Groups "v8-users" group.
To unsubscribe from this group and stop receiving emails from it, send an email to v8-users+u...@googlegroups.com.
For more options, visit https://groups.google.com/d/optout.
dmonji
Sep 18, 2015, 7:13:01 AM9/18/15
to v8-users
Is there any way to measure it?
I tried to instrument the JavaScript code, and summed up the time between "before access" and "after access". But I am not very sure if this is
I tried to instrument the JavaScript code, and summed up the time between "before access" and "after access". But I am not very sure if this is
the right way to measure the time required for property accesses. Any thoughts on this?
Jakob Kummerow
Sep 18, 2015, 9:14:43 AM9/18/15
to v8-users
I don't think it's possible to measure property access times directly. One reason is that a single property access is much, much faster than getting a timestamp from the operating system.
So your best bet is probably to measure it indirectly: take a long-running loop, add a single property access in such a way that (1) it can't be optimized away by the compiler and (2) it doesn't introduce additional operations, which isn't easy to achieve at the same time, and measure how much longer the overall loop takes than it did before.
Of course that would be a very artificial micro-benchmark, and would only measure one very specific situation. In the general case, property accesses can take very different amounts of time, though: in the best case, they're a single machine instruction; in the worst case, they're thousands of machine instructions. It all depends on so many things...
I can't think of a way to take an existing program and accurately measure what fraction of its running time is spent on property accesses.
dmonji
Sep 30, 2015, 8:55:50 AM9/30/15
to v8-users
What does the percentage mentioned in brackets refer to? Does ic miss (24.3%) means 24.3 % of total execution time was spent on inline cache misses? But
surprisingly these percentages do not add to 100%.
Also, is it possible to see JITed code, where I can see how the code looks with inline caches? I am aware of --trace_ic which gives out the information about
LOADIC and STOREIC. But I want to see how the original code looks after introducing code for inline caching.
Jakob Kummerow
Sep 30, 2015, 9:23:31 AM9/30/15
to v8-users
On Wed, Sep 30, 2015 at 2:55 PM, dmonji <monika...@gmail.com> wrote:
What does the percentage mentioned in brackets refer to? Does ic miss (24.3%) means 24.3 % of total execution time was spent on inline cache misses?
Yes, including potential over-reporting.
But surprisingly these percentages do not add to 100%.
Some ticks might not be attributable. Ticks outside V8 definitely don't show up.
Also, is it possible to see JITed code, where I can see how the code looks with inline caches?
--print-code for unoptimized code (right after being generated, i.e. all ICs still uninitialized)
--print-opt-code for optimized code (same note)
--code-comments might help make sense of it all
--help for self-education
I am aware of --trace_ic which gives out the information aboutLOADIC and STOREIC. But I want to see how the original code looks after introducing code for inline caching.
I don't know what you mean by "after introducing code for inline caching". The call targets get patched, that's all... no code is added.
Reply all
Reply to author
Forward
0 new messages