Proposed enhancement(s) to performance metrics
42 views
Skip to first unread message

Adam Tuttle
Feb 17, 2014, 5:10:38 PM2/17/14
to taffy...@googlegroups.com
I was just thinking that it would be nice if the performance metrics that we can see currently:
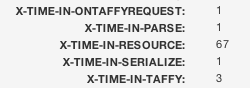
... included query times. There are things we'd need to figure out, but would you find something like that useful? It would essentially be a way of drilling down into the X-TIME-IN-RESOURCE value more to separate querying from data-manipulation.
My initial thought is that Taffy could provide a wrapper for CFQuery. I've already been using iQuery in my script-based resources (which is to say, most of them) for some time now without issue. It's a much clearer script query syntax and doesn't suffer any tangible performance problems. It would be simple to add it to Taffy's bonus folder, such that your queries would look like this:
local.result = new taffy.bonus.query(
"select * from users where userid = :id",
{ id = arguments.id },
{ cachedWithin = createTimeSpan(0,0,10,0) }
);
If I did this, I could easily track DB metrics as well. The tricky part would be deciding how to report them (in aggregate? details? ...)
---
Now that I'm writing this down, what if instead Taffy gave you a method that you could call to track metrics of arbitrary functionality?
metricStart('userQuery');
//... query here
metricEnd('userQuery');
... which would result in that value being returned as a header and also being subtracted from the resource-time value.
Would that be more useful? The query thing would be automatic: Just use the Taffy query class and it tracks and reports metrics for your automatically, vs. arbitrary metrics that require a few additional lines of code wherever you want to track them.
---
Anyhow... just a thought. What say you?
Adam

Jesse Franceschini
Feb 24, 2014, 11:36:18 AM2/24/14
to taffy...@googlegroups.com
I was just thinking about trying to measure query times, so this would definitely be something I'd use. Your implementation sounds fine to me, I was thinking about giving iQuery a try, and for someone who doesn't have the ability to install and use custom tags, having it included in the bonus directory has me interested even more.
Adam Tuttle
Feb 24, 2014, 11:49:05 AM2/24/14
to taffy...@googlegroups.com
Cool,
So keeping in mind that the response will be a plain text header, how would you want to see the value returned?
- What if there are multiple queries?
- Combine them?
- comma-delimited list of times?
- Find a way to name them and use the name?
Adam
--
You received this message because you are subscribed to the Google Groups "Taffy Users" group.
To unsubscribe from this group and stop receiving emails from it, send an email to taffy-users...@googlegroups.com.
For more options, visit https://groups.google.com/groups/opt_out.
Jesse Franceschini
Feb 24, 2014, 12:02:46 PM2/24/14
to taffy...@googlegroups.com
Good questions.
The ideal scenario would be to list all queries out with unique names so we could identify slow queries or see if the number of queries being run is as expected. Maybe the unique name could be namespaced from the cfc performing the query call? Something like "X-TIME-IN-QUERY-{NAMESPACE}". Does that risk displaying too much internal stuff in the headers?
If that's too hairy, then maybe a comma delimited list of times under a generic "X-TIMES-IN-QUERIES" header would be enough.
Jesse Franceschini
Feb 24, 2014, 1:04:54 PM2/24/14
to taffy...@googlegroups.com
Or, now that I've thought about it, maybe a combination of the namespace and comma-delimited idea. If the same query runs multiple times, just add those execution times to a comma-delimited list under that query's header. That way, if someone runs the same query multiple times, it doesn't pollute the headers.
Adam Tuttle
Feb 24, 2014, 1:10:04 PM2/24/14
to taffy...@googlegroups.com
What if there are multiple distinct queries in a resource? What if a query is run from onTaffyRequest?
Adam
Jesse Franceschini
Feb 24, 2014, 4:44:17 PM2/24/14
to taffy...@googlegroups.com
There's still a lot about coldfusion that I'm learning, but is it possible for queries to be identified down to the function that is calling them? On top of that, can the query name and/or results attributes be retrieved? With the CFC, the function, and the query name, I think that information is sufficient to make distinct queries identifiable.
As for queries run onTaffyRequest, perhaps this can be solved by applying a default CFC and function entry to the namespace. The function would be "onTaffyRequest" and the CFC could be "Application", since that's where it is. So a sample header for a query run in onTaffyRequest would be "X-TIME-IN-QUERY-APPLICATION-ONTAFFYREQUEST-{query name}".
Just throwing ideas out, hopefully they make sense. I'm still trying to get a sense of what's practical in situations like this.
Reply all
Reply to author
Forward
0 new messages