Submap of a rotated map
24 views
Skip to first unread message

Dale Weigt
Aug 9, 2017, 10:23:43 AM8/9/17
to SunPy
Hi,
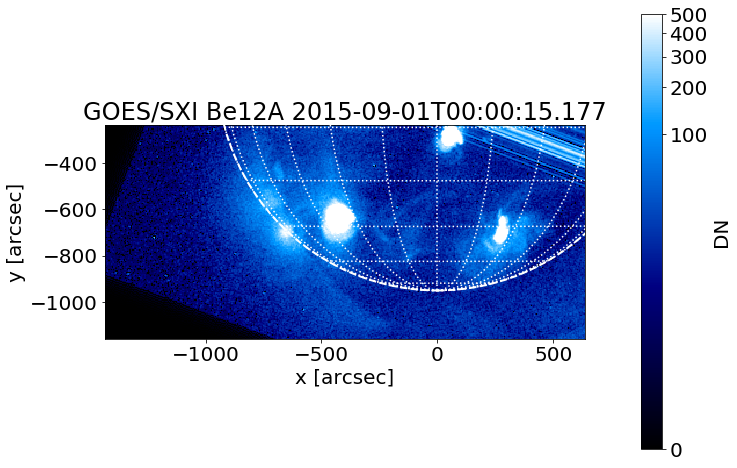
I am relatively new to python and sunpy and I have encountered a problem when trying to take a submap of a rotated map.
I am working with SXI data and comparing it to other telescopes (hence the rotation) and when I specify a certain region of a map, after rotation, it does not give the correct xy-axes. I was wondering if it may be a bug sunpy itself as I tried it with the AIA maps and encountered a similar problem (just to test).
Below is the code I am using in case there is something wrong with that:
# Reading the SXI file
SXI_file = r'C:\Users\Dale\Desktop\Summer Internship\2017\NuSTAR\SXI\sxi_20150901_B\sxi_20150901_B_data\SXI_20150901_000015177_BA_15.FTS'
# Obtaing the header info and data of the SXI file
hdulist = fits.open(SXI_file)
hdr = hdulist[0].header
SXI_data = hdulist[0].data
obs_time=hdr['date_obs']
# Manually creating the SXI map
# Have I got everything?
header = {'cdelt1': hdr['cdelt1'],'cdelt2': hdr['cdelt2'],
'instrume':'SXI','detector':'SXI',
'xcen':hdr['xcen'],'ycen':hdr['ycen'],'telescop':hdr['telescop'],
'exptime':hdr['exptime'],'date_obs':hdr['date_obs'],'wavelnth':12,
'crpix1':hdr['crpix1'],'crpix2':hdr['crpix2'], 'crval1':hdr['crval1'],
'crval2':hdr['crval2'],
# to stop getting warning about missing metadata about where observer is
'HGLT_OBS': 0,'HGLN_OBS': 0,
'RSUN_OBS': sun.solar_semidiameter_angular_size(obs_time).value,
'RSUN_REF': sun.constants.radius.value,
'DSUN_OBS': sun.sunearth_distance(obs_time).value*u.astrophys.au}
hdulist.close()
# Creating and formatting the SXI map
SXI_map = sunpy.map.Map(SXI_data, header)
SXI_map_rotato = SXI_map.rotate(angle = hdr['crota1']*u.deg) # applying the rotation from the data using the CoR angle provided
SXI_map_rotato = SXI_map_rotato.shift(75*u.arcsec, 0*u.arcsec) # Shifting the data so ~ alligned with the solar limb
SXI_map_rotato.plot_settings['norm'] = colors.PowerNorm(gamma=0.2,vmax=5e2)#,vmin=5,vmax=1000)
SXI_map_rotato.plot_settings['cmap'] = cm.get_cmap('stereohi1')
And this is the submap I'm trying to create:
rangex = u.Quantity([400*u.arcsec, -1200 * u.arcsec])
rangey = u.Quantity([100 * u.arcsec, -1500 * u.arcsec])
srsxi_map = SXI_map_rotato.submap(rangex, rangey)
fig = plt.figure(figsize=(10, 8))
ax = plt.subplot()
srsxi_map.plot()
srsxi_map.draw_limb(color='white',linewidth=2,linestyle='dashed')
srsxi_map.draw_grid()
ax.set_title('GOES/SXI Be12A '+obs_time.format('{:%Y-%m-%d %H:%M:%s}').format(srsxi_map.date))
ax.set_ylabel('y [arcsec]')
ax.set_xlabel('x [arcsec]')
plt.colorbar(fraction=0.04, pad=0.1,label='DN')
plt.show()
As shown in the attached image the axis don't correspond to the ranges I have picked.
Any help/pointers would be very much appreciated!
Many thanks,
Dale Weigt
Reply all
Reply to author
Forward
0 new messages