Plot a map as an image only with no annotations

297 views
Skip to first unread message

JohnM

unread,
Oct 25, 2016, 1:53:42 PM10/25/16
to SunPy
I am trying to plot an AIA image with no extra labeling--no grid,
no ticks, no x-axis or y-axis numbers. peek() with appropriate
kwargs will do this, but complains about WCSAxes not being used.
If instead, I go with plot() after setting the projection in the
subplot command, the complaints go away, but the grid, and x- and
y-axis annotations remain. The standard way of removing these is
to use ax.set_axis_off(), but that does not seem to work. Short
sample code below. Can anyone point me to the appropriate 
incantations to both eliminate the WCSAxes complaints and remove
all the axis info?

Many thanks,
John M.

#!/usr/bin/env python

import sunpy.map
import matplotlib.pyplot as plt

file = 'aia.lev1.193A_2013-07-29T05_41_30.84Z.image_lev1.fits'
aia = sunpy.map.Map(file)

# This produces a plot with no WCSAxes complaints but does not remove
# axis info.
fig = plt.figure(frameon=False)
ax = plt.subplot(111, projection=aia.wcs)
ax.set_axis_off()
aia.plot(annotate=False)
plt.savefig('map.png')

Stuart Mumford

unread,
Oct 25, 2016, 2:21:31 PM10/25/16
to su...@googlegroups.com

Hello John,

When you do peek(basic_plot=True) those warnings should not be issued, it doesn't matter that the plot axes might be incorrect if there are no plot axes! I have made a fix here: https://github.com/sunpy/sunpy/pull/1930 which will be included in the next bug fix release (probably later this week) but until then I suggest you just ignore them.

Thanks for the heads up.

Stuart

--
You received this message because you are subscribed to the Google Groups "SunPy" group.
To unsubscribe from this group and stop receiving emails from it, send an email to sunpy+un...@googlegroups.com.
To post to this group, send email to su...@googlegroups.com.
Visit this group at https://groups.google.com/group/sunpy.
For more options, visit https://groups.google.com/d/optout.

JohnM

unread,
Oct 25, 2016, 2:27:21 PM10/25/16
to SunPy
Hi Stuart,

Thanks for the prompt reply. Is there no way to eliminate all the labeling when using the plot() command?

John M.

JohnM

unread,
Oct 25, 2016, 2:40:36 PM10/25/16
to SunPy
Just to clarify why I want to use the plot() command to plot the image. I also want to be able to add a box to the image based on a set of coordinates that may have to be rotated to the time of the AIA image.

Stuart Mumford

unread,
Oct 25, 2016, 5:39:20 PM10/25/16
to su...@googlegroups.com

Hi,

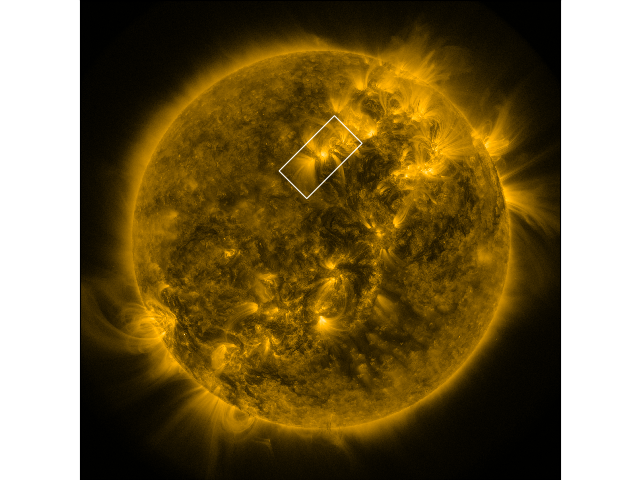
The following code snippet manually turns off all the WCSAxes labelling and grids that are added by default when doing map.plot().

import matplotlib.pyplot as plt
import sunpy.map
from sunpy.data.sample import AIA_171_ROLL_IMAGE

m = sunpy.map.Map(AIA_171_ROLL_IMAGE)

figure = plt.figure()
axes = figure.add_axes([0,0,1,1], projection=m.wcs)
axes.set_axis_off()
im = m.plot(axes=axes)
rect = m.draw_rectangle([100, 200]*u.arcsec, 400*u.arcsec, 200*u.arcsec)

#turn off everything!

Tx, Ty = axes.coords
Tx.set_ticks_visible(False)
Ty.set_ticks_visible(False)
Tx.set_ticklabel_visible(False)
Ty.set_ticklabel_visible(False)
Tx.set_axislabel('')
Ty.set_axislabel('')
axes.coords.grid(False)

It generates the attached plot using the sample data.

Hope that helps,

Stuart


On 25/10/16 11:40, JohnM wrote:
Just to clarify why I want to use the plot() command to plot the image. I also want to be able to add a box to the image based on a set of coordinates that may have to be rotated to the time of the AIA image.

nogrid_wcsaxes.png

JohnM

unread,
Oct 25, 2016, 5:53:26 PM10/25/16
to SunPy
Perfect! I had managed to figure out all but the bottom part where everything gets turned off.

For some earlier projects, I have been rolling my own plots and avoiding SunPy. I am gradually coming around to the notion that it may indeed be the best approach long term. Again thanks so much for your prompt assistance.

John M.
Reply all
Reply to author
Forward
0 new messages