Complex Chart
24 views
Skip to first unread message

Brooke Bender
Jul 10, 2015, 12:23:05 PM7/10/15
to sofasta...@googlegroups.com
Hello - I am new to SOFA and this discussion group. I've looked online and can't find directions for the type of chart I want to create. I have a pre/post test with 20 different questions - I've recoded to include only correct(1)/incorrect(0) variables for each. I want to create a bar chart that shows proportion correct vs. incorrect, pre vs. post, for all 20 questions in the same chart. Please help.
Thanks!
Brooke
Thanks!
Brooke
Brooke Bender
Jul 10, 2015, 12:25:18 PM7/10/15
to sofasta...@googlegroups.com
In addition, I'm running a Chi-Square on each and want to be able to include statistical significance for each question. I don't know how to pull all of this together.

Grant Paton-Simpson
Jul 12, 2015, 4:43:04 PM7/12/15
to sofasta...@googlegroups.com
Hi Brooke,
The issue is the data structure (wide vs long). See http://www.sofastatistics.com/wiki/doku.php?id=help:data_structure
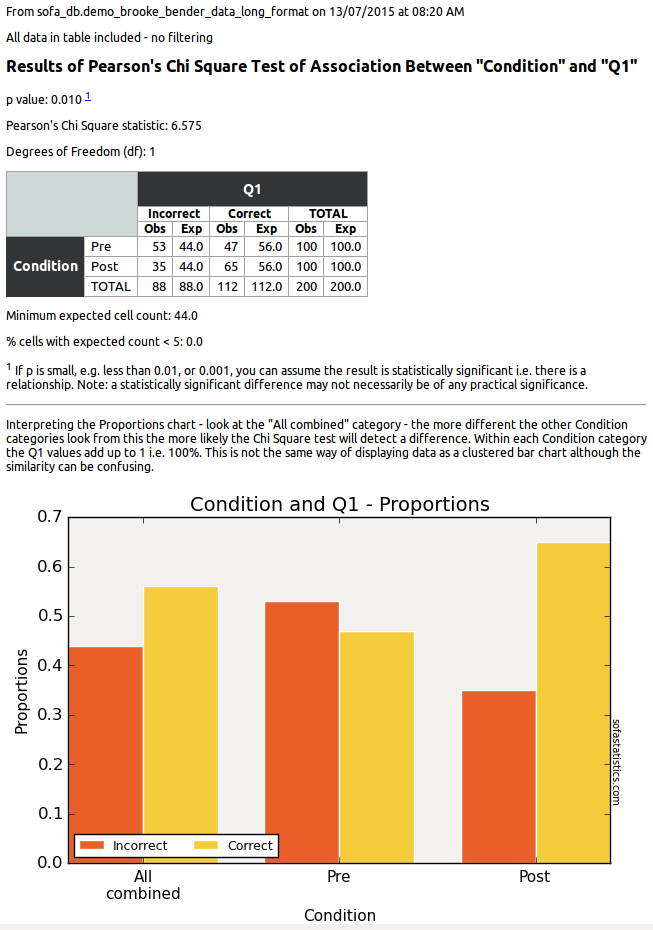
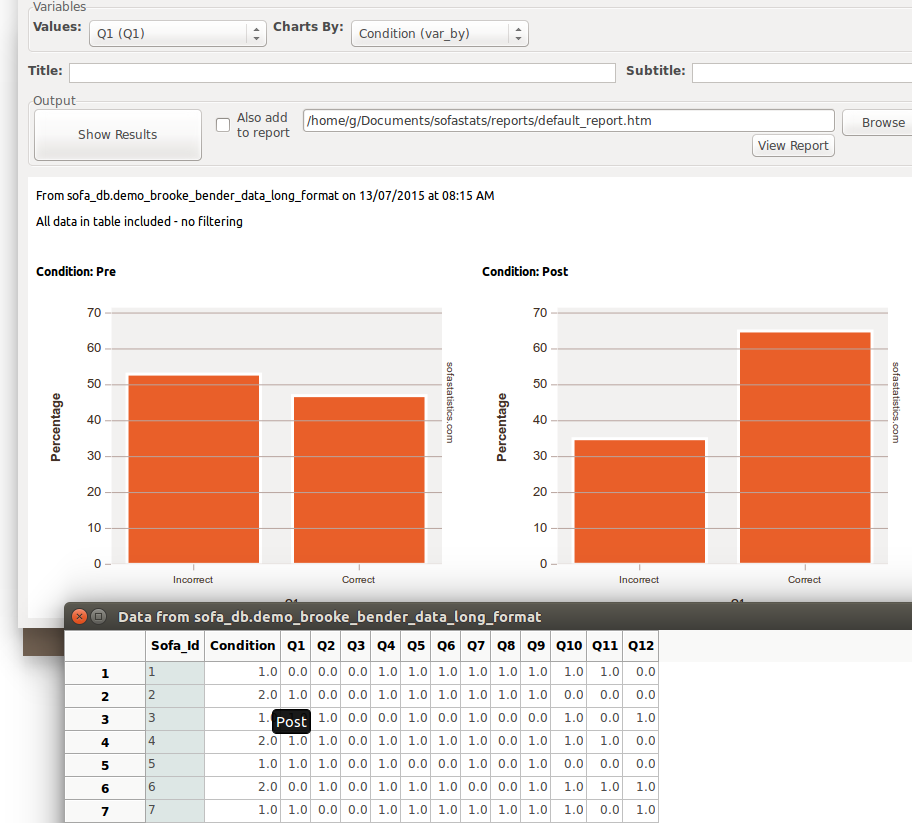
I have made two datasets (containing the same data) and run some bar charts and chi square tests on the long format version of the data.
This is for demonstration purposes only and apologies if any mistakes etc - did it in some spare time.
The Chi Square tests don't leverage the benefits of your data being paired (pre and post) but you will be able to see if there is a difference.
BTW how much data do you potentially need to restructure? How many rows?
All the best,
Grant
The issue is the data structure (wide vs long). See http://www.sofastatistics.com/wiki/doku.php?id=help:data_structure
I have made two datasets (containing the same data) and run some bar charts and chi square tests on the long format version of the data.
This is for demonstration purposes only and apologies if any mistakes etc - did it in some spare time.
The Chi Square tests don't leverage the benefits of your data being paired (pre and post) but you will be able to see if there is a difference.
BTW how much data do you potentially need to restructure? How many rows?
All the best,
Grant
--
---
You received this message because you are subscribed to the Google Groups "sofastatistics" group.
To unsubscribe from this group and stop receiving emails from it, send an email to sofastatistic...@googlegroups.com.
For more options, visit https://groups.google.com/d/optout.

Brooke Bender
Jul 12, 2015, 5:02:28 PM7/12/15
to sofasta...@googlegroups.com
Hi Grant,
Brooke
Thank you very much for your quick, detailed response!
I originally organized my data in the long format and chose to look at differences with Chi-Square because the survey was anonymous so I can't compare individual level pre/post. There are 115 rows total including the header in my data set (76 pre/38 post responses).
I ran Chi-Square test on each of the 20 questions, 16 had a p-value of significance. I want to create a chart that include the pre/post percentages for all 16 of those questions combined, and another chart for the 4 that did not show significance together, is there a way to do this in SOFA? For now I've gone ahead and done so in excel.
Thanks!
Brooke
---
Brooke Bender, MPH | Quality & Evaluation Specialist
Brooke Bender, MPH | Quality & Evaluation Specialist
Coldspring Center for Social and Health Innovation
P.O. Box 18292 | Denver, Colorado 80218
This email is covered by the Electronic Communications Privacy Act, 18 U.S.C. Section 2510-2521 and is legally privileged. This message and any attachments hereto may contain confidential information intended only for the use of the individual or entity named above. If you are not the intended recipient(s), or the employee or agent responsible for delivery of this message to the intended recipient(s), you are hereby notified that any dissemination, distribution or copying of this email message is strictly prohibited. If you have received this message in error, please immediately notify the sender and delete this email from your computer. The sender does not waive any privilege in the event this message was inadvertently disseminated.
--
---
You received this message because you are subscribed to a topic in the Google Groups "sofastatistics" group.
To unsubscribe from this topic, visit https://groups.google.com/d/topic/sofastatistics/hg7gNWt8hG4/unsubscribe.
To unsubscribe from this group and all its topics, send an email to sofastatistic...@googlegroups.com.
Grant Paton-Simpson
Jul 12, 2015, 5:51:03 PM7/12/15
to sofasta...@googlegroups.com
Hi Brooke,
On 13/07/15 09:02, Brooke Bender wrote:
Hi Grant,
Thank you very much for your quick, detailed response!
I originally organized my data in the long format and chose to look at differences with Chi-Square because the survey was anonymous so I can't compare individual level pre/post. There are 115 rows total including the header in my data set (76 pre/38 post responses).
I ran Chi-Square test on each of the 20 questions, 16 had a p-value of significance. I want to create a chart that include the pre/post percentages for all 16 of those questions combined
Need another restructured dataset with all questions in same column
and q number in a single q_num column.
, and another chart for the 4 that did not show significance together,
Same approach - then SOFA can import and analyse.
All the best,
Grant
All the best,
Grant
Brooke Bender
Jul 13, 2015, 2:00:06 PM7/13/15
to sofasta...@googlegroups.com
Hi Grant,
Brooke
Unfortunately, it looks like your last email got cut off.
Brooke
---
Brooke Bender, MPH | Quality & Evaluation Specialist
Brooke Bender, MPH | Quality & Evaluation Specialist
Coldspring Center for Social and Health Innovation
P.O. Box 18292 | Denver, Colorado 80218
This email is covered by the Electronic Communications Privacy Act, 18 U.S.C. Section 2510-2521 and is legally privileged. This message and any attachments hereto may contain confidential information intended only for the use of the individual or entity named above. If you are not the intended recipient(s), or the employee or agent responsible for delivery of this message to the intended recipient(s), you are hereby notified that any dissemination, distribution or copying of this email message is strictly prohibited. If you have received this message in error, please immediately notify the sender and delete this email from your computer. The sender does not waive any privilege in the event this message was inadvertently disseminated.
Brooke Bender
Jul 13, 2015, 2:01:37 PM7/13/15
to sofasta...@googlegroups.com
Oops, sorry, I just realized the rest of your email was entered within the text of my email. Thank you!
Brooke
Brooke
---
Brooke Bender, MPH | Quality & Evaluation Specialist
Brooke Bender, MPH | Quality & Evaluation Specialist
Coldspring Center for Social and Health Innovation
P.O. Box 18292 | Denver, Colorado 80218
This email is covered by the Electronic Communications Privacy Act, 18 U.S.C. Section 2510-2521 and is legally privileged. This message and any attachments hereto may contain confidential information intended only for the use of the individual or entity named above. If you are not the intended recipient(s), or the employee or agent responsible for delivery of this message to the intended recipient(s), you are hereby notified that any dissemination, distribution or copying of this email message is strictly prohibited. If you have received this message in error, please immediately notify the sender and delete this email from your computer. The sender does not waive any privilege in the event this message was inadvertently disseminated.
Reply all
Reply to author
Forward
0 new messages