all x-values not showing on scatterplot
15 views
Skip to first unread message

Charles Hartley
Jan 24, 2014, 1:20:15 AM1/24/14
to sofasta...@googlegroups.com
Hi Grant,
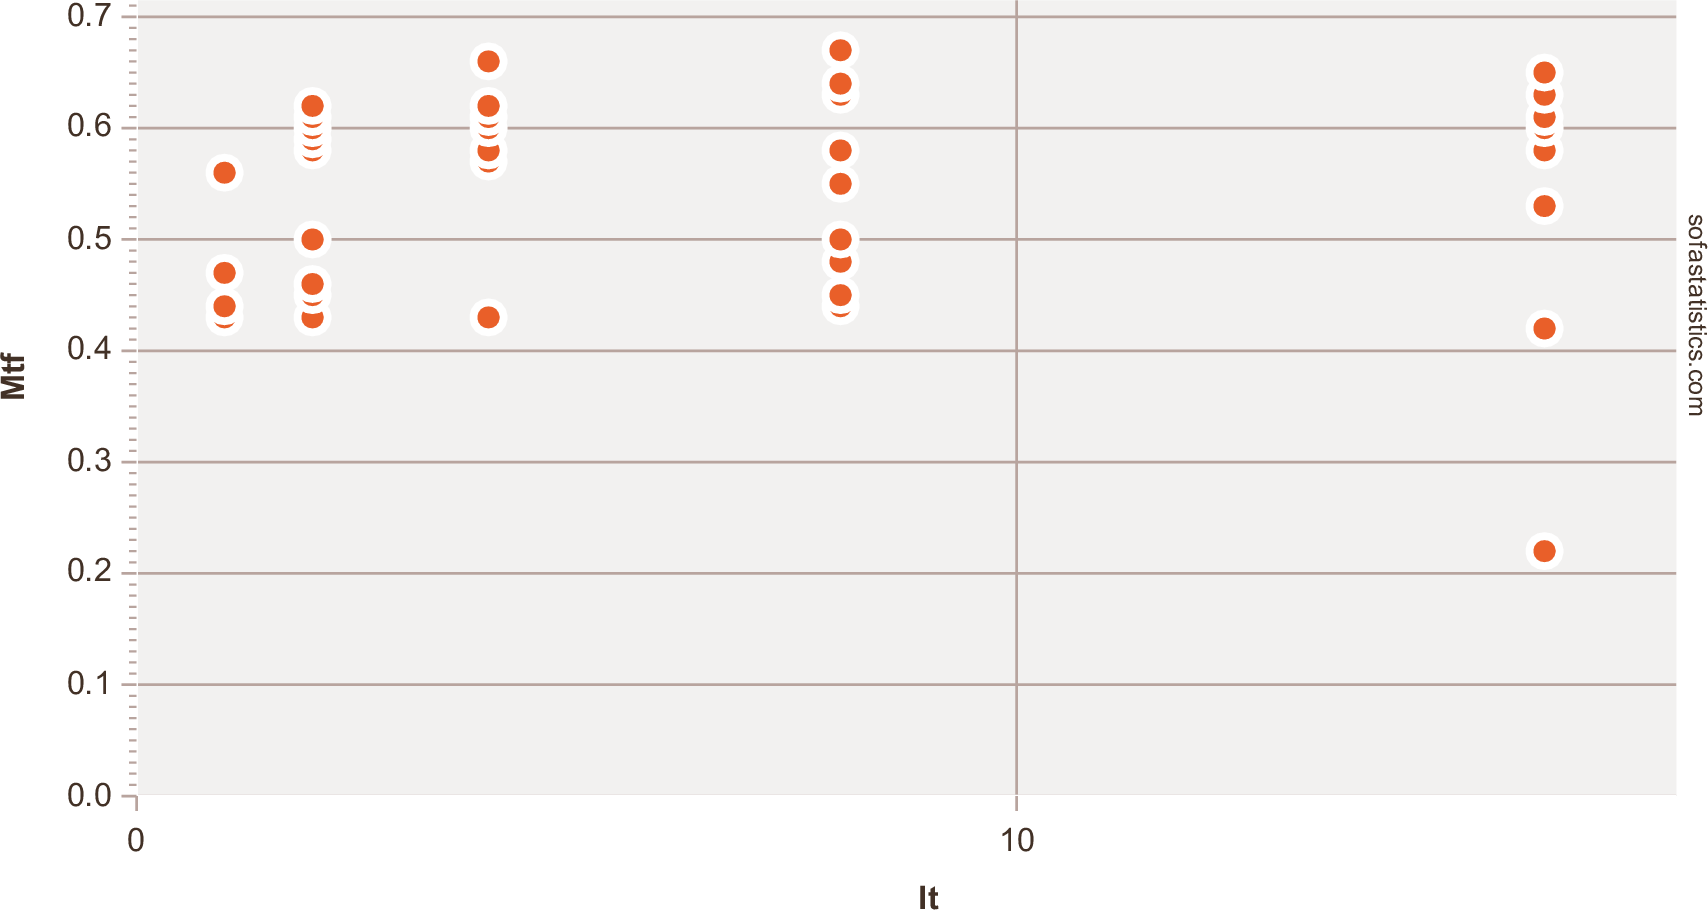
I've got some real simple graphs I'm trying to plot, but when I generate the plot the only values that show are "0" (of course) and "10" when possible values are fixed at "1" "2" "4" "8" "16" (integration times for x-ray setup).
It seems odd because I have another chart I ran that only has 9 values (1-9) and each of the values prints along x-axis.
Cheers,
Charles

Grant Paton-Simpson
Jan 29, 2014, 3:42:43 AM1/29/14
to sofasta...@googlegroups.com
Hi Charles,
I've altered a setting so that the minor ticks show unless there are fewer than 4 separate x values (it was set to 10 for reasons I can't remember). So the next version will fix that. Or you can manually change line 2653 (approx) from
few_unique_x_vals = (len(x_set) < 10)
to
few_unique_x_vals = (len(x_set) < 4)
in charting_output.py (e.g. in Program Files\sofatstats).
All the best,
Grant
--
---
You received this message because you are subscribed to the Google Groups "sofastatistics" group.
To unsubscribe from this group and stop receiving emails from it, send an email to sofastatistic...@googlegroups.com.
For more options, visit https://groups.google.com/groups/opt_out.
Charles Hartley
Jan 29, 2014, 10:57:46 AM1/29/14
to sofasta...@googlegroups.com
Great, thanks Grant. Yes, I'll go ahead and change my version for now.
Cheers,
Charles
Reply all
Reply to author
Forward
0 new messages