Some Snort alerts not working after 14.04 update

Jeff H
Looking at past Snort alerts I think there may be other rules that are no longer firing, but this is the only one I am sure of.
It looks to me like the last alerts I got for those were the day before updating to 14.04.
I have EXE downloads listed in ELSA that should have alerted on this Snort rule.
To test I downloaded an executable, found it listed in ELSA under Sites hosting EXEs. Pivot to capme to download pcap and open it in Wireshark and can export the executable.
I have another system with Snort installed that I use for analysis and I ran the pcap through Snort there with the rule loaded and it alerted as expected.
sostat-redacted attached (I know I have a lot of Snort rules enabled, but this is a home lab setup and the hardware seems to be able to handle the amount of rules. I had the same amount of rules running prior to the 14.04 update and this rule alerted just fine.)
Verifying the rule is not disabled:
$ grep 2000419 /etc/nsm/rules/downloaded.rules
alert tcp $EXTERNAL_NET any -> $HOME_NET any (msg:"ET POLICY PE EXE or DLL Windows file download"; flow:established,to_client; content:"MZ"; byte_jump:4,58,relative,little; content:"PE|00 00|"; distance:-64; within:4; flowbits:set,ET.http.binary; reference:url,doc.emergingthreats.net/bin/view/Main/2000419; classtype:policy-violation; sid:2000419; rev:18;)
alert tcp $EXTERNAL_NET $HTTP_PORTS -> $HOME_NET any (msg:"ET POLICY PE EXE or DLL Windows file download HTTP"; flow:established,to_client; flowbits:isnotset,ET.http.binary; file_data; content:"MZ"; within:2; byte_jump:4,58,relative,little; content:"PE|00 00|"; distance:-64; within:4; flowbits:set,ET.http.binary; reference:url,doc.emergingthreats.net/bin/view/Main/2000419; classtype:policy-violation; sid:2018959; rev:2;)
I recently disabled eth2 as a monitoring interface, but that was done a couple days ago, and it looks like this issue started when I upgraded to 14.04
Any help tracking this down would be appreciated.
Thanks

Doug Burks
Do you have any suppressions or autocats enabled?
> You received this message because you are subscribed to the Google Groups "security-onion" group.
> To unsubscribe from this group and stop receiving emails from it, send an email to security-onio...@googlegroups.com.
> To post to this group, send email to securit...@googlegroups.com.
> Visit this group at https://groups.google.com/group/security-onion.
> For more options, visit https://groups.google.com/d/optout.
--
Doug Burks
Need Security Onion Training or Commercial Support?
http://securityonionsolutions.com
Jeff H
Hi Jeff,
Do you have any suppressions or autocats enabled?
--
Doug Burks
Jeff H
Hi Doug, I do have some suppressions in place, but nothing for sid 2000419. I don't have any autocats enabled.Jeff
Doug Burks
What do you have EXTERNAL_NET set to?
Can you provide the CapMe transcript?
Jeff H
What do you have HOME_NET set to?
What do you have EXTERNAL_NET set to?
Can you provide the CapMe transcript?
Doug Burks
alert for ET rule 2000419 as it should. I then increased my Snort
instances from 1 to 2 and Snort still alerted properly.
Have you tried rebooting?
Have you tried lowering your Snort instances from 2 to 1 (IDS_LB_PROCS
in sensor.conf)?
Jeff H
I tcpreplay'd your pcap in a 14.04 VM and Snort definitely fired an
alert for ET rule 2000419 as it should. I then increased my Snort
instances from 1 to 2 and Snort still alerted properly.
Have you tried rebooting?
Have you tried lowering your Snort instances from 2 to 1 (IDS_LB_PROCS
in sensor.conf)?
ethtool: bad command line argument(s)
For more information run ethtool -h
These specific features weren't mentioned in the Security Onion blog post above, so I am just guessing if they need to be on or off. Are you able to Give guidance on them?
This Security Onion system is running in ESXi and I haven't changed any NIC offloading settings in ESXi (I'm not sure if that is necessary). But I do know these alerts were working properly before the upgrade and my VLAN/network hasn't changed.
Jeff
Jeff H
Jeff H
Doug Burks
14.04 to see if it works there?
Jeff H
Have you tried a new VM with a fresh installation of Security Onion
14.04 to see if it works there?

Heine Lysemose
This part is from the suricata configuration file …
# This option controls the use of vlan ids in the flow (and defrag)
# hashing. Normally this should be enabled, but in some (broken)
# setups where both sides of a flow are not tagged with the same vlan
# tag, we can ignore the vlan id's in the flow hashing.
vlan:
use-for-tracking: true
Could that maybe help you with the detection?
Regards,
Lysemose
--
Jeff H
This part is from the suricata configuration file …
# This option controls the use of vlan ids in the flow (and defrag)
# hashing. Normally this should be enabled, but in some (broken)
# setups where both sides of a flow are not tagged with the same vlan
# tag, we can ignore the vlan id's in the flow hashing.
vlan:
use-for-tracking: true
Could that maybe help you with the detection?
Regards,
Lysemose
Jeff H
Thanks Lysemose, but that didn't help either.Really starting to bang my head against the wall on this one.Can anyone advise how I can see the VLAN tags on traffic captured by Security Onion?Jeff
Doug Burks
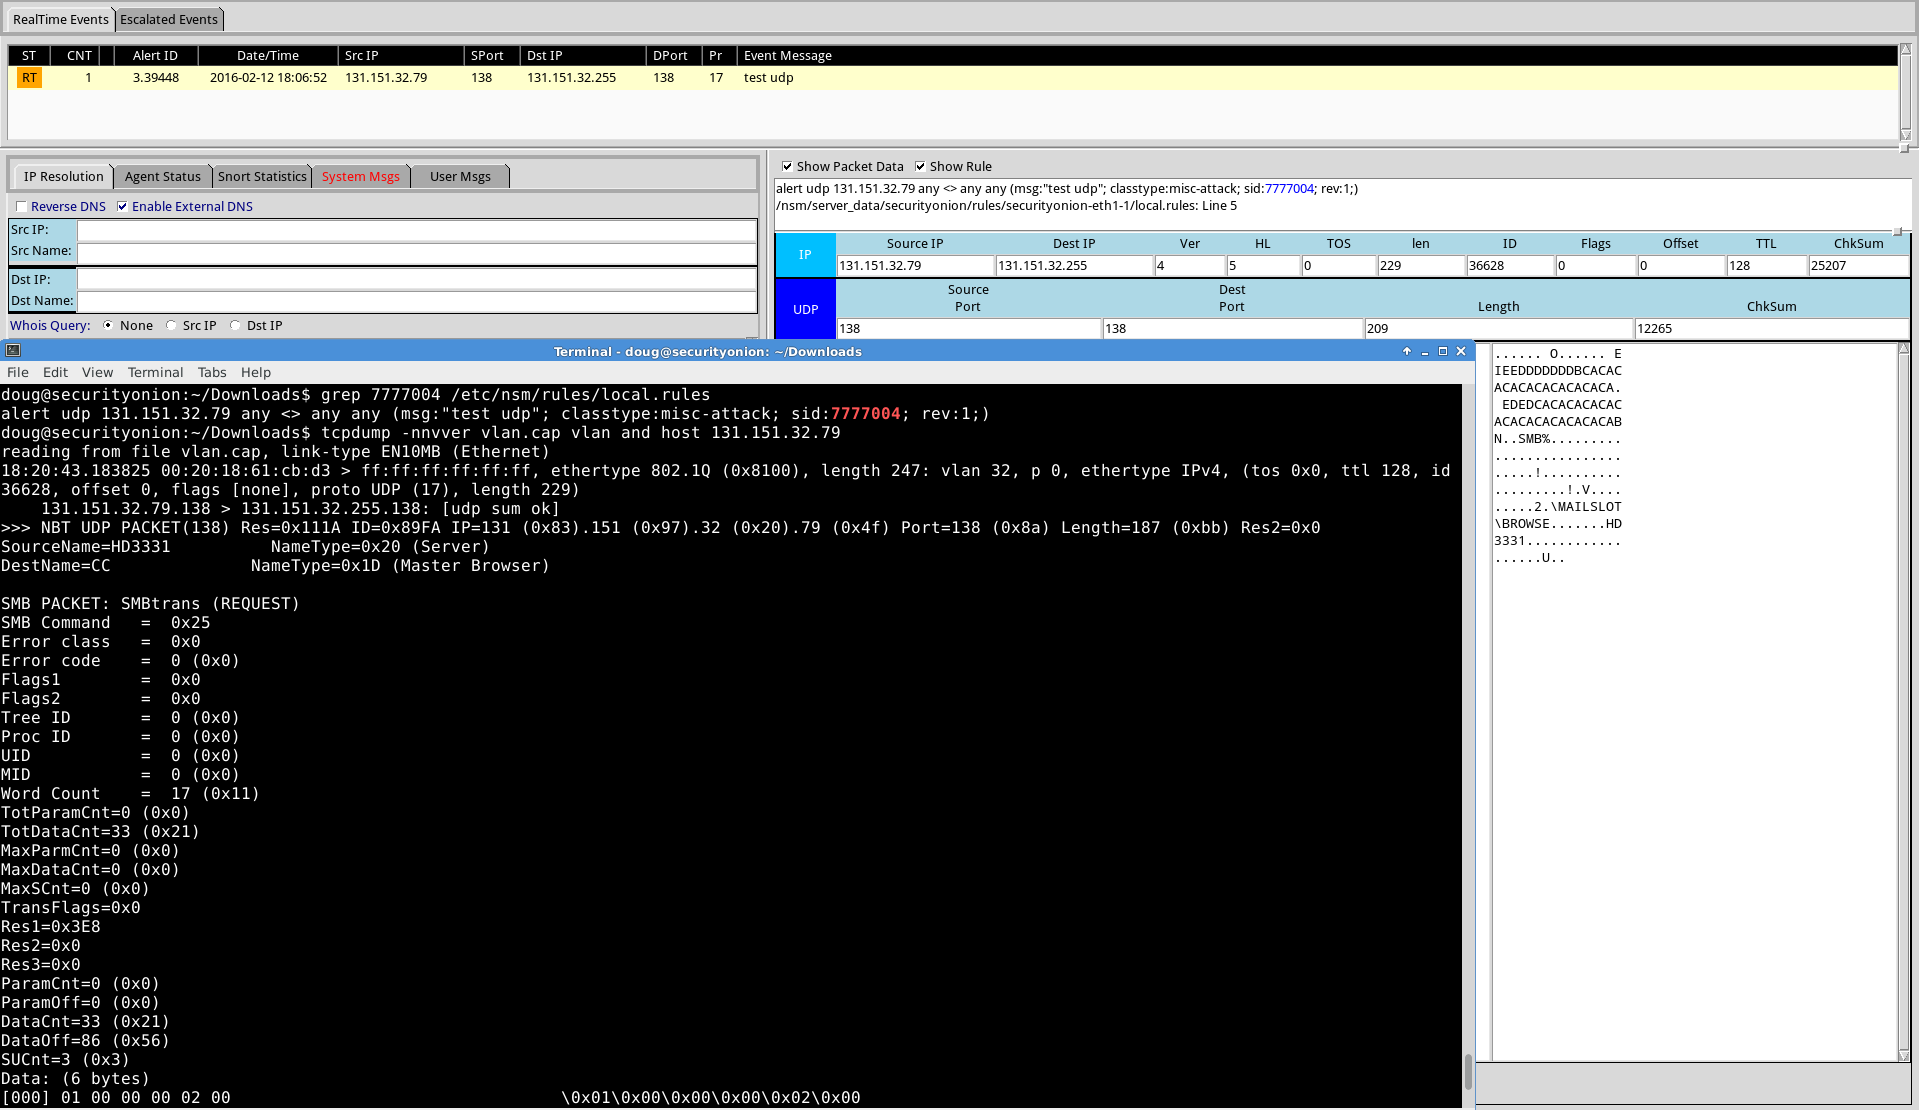
- started with a VM with the Security Onion 14.04.3.1 ISO image
- downloaded vlan.cap.gz from Wireshark sample captures:
https://wiki.wireshark.org/SampleCaptures?action=AttachFile&do=get&target=vlan.cap.gz
- gunzip vlan.cap.gz
- used tcpdump to find an IP address in the pcap that only occurred in
vlan tagged traffic
- wrote a Snort rule to alert on traffic from that IP address and
added to /etc/nsm/rules/local.rules
- ran "sudo rule-update"
- used tcpreplay to replay vlan.cap to sniffing interface eth1
- verified that Snort alerted properly on the vlan tagged traffic (see
attached screenshot)
Based on this test, Snort appears to be alerting properly on vlan
tagged traffic.
Are you able to duplicate this test and perhaps compare to your live
vlan tagged traffic looking for any differences?
Just to confirm, when you run Security Onion Setup, are you allowing
it to configure /etc/network/interfaces? Can you send a copy of your
/etc/network/interfaces file?
> You received this message because you are subscribed to the Google Groups
> "security-onion" group.
> To unsubscribe from this group and stop receiving emails from it, send an
> email to security-onio...@googlegroups.com.
> To post to this group, send email to securit...@googlegroups.com.
> Visit this group at https://groups.google.com/group/security-onion.
> For more options, visit https://groups.google.com/d/optout.
Jeff H
I did the following test:
- started with a VM with the Security Onion 14.04.3.1 ISO image
- downloaded vlan.cap.gz from Wireshark sample captures:
https://wiki.wireshark.org/SampleCaptures?action=AttachFile&do=get&target=vlan.cap.gz
- gunzip vlan.cap.gz
- used tcpdump to find an IP address in the pcap that only occurred in
vlan tagged traffic
- wrote a Snort rule to alert on traffic from that IP address and
added to /etc/nsm/rules/local.rules
- ran "sudo rule-update"
- used tcpreplay to replay vlan.cap to sniffing interface eth1
- verified that Snort alerted properly on the vlan tagged traffic (see
attached screenshot)
Based on this test, Snort appears to be alerting properly on vlan
tagged traffic.
Are you able to duplicate this test and perhaps compare to your live
vlan tagged traffic looking for any differences?
Just to confirm, when you run Security Onion Setup, are you allowing
it to configure /etc/network/interfaces? Can you send a copy of your
/etc/network/interfaces file?
Doug Burks
Just to confirm, when you run Security Onion Setup, are you allowing
it to configure /etc/network/interfaces? Can you send a copy of your
/etc/network/interfaces file?
Heine Lysemose
Any applied BPF filters?
Regards,
Lysemose
From: Doug Burks
Sent: 12. februar 2016 23:01
To: securit...@googlegroups.com
Subject: Re: [security-onion] Some Snort alerts not working after 14.04 update
I didn't see a response to this part, so let me try again:
Jeff H
$ ethtool -g eth1
Ring parameters for eth1:
Pre-set maximums:
RX: 4096
RX Mini: 0
RX Jumbo: 0
TX: 4096
Current hardware settings:
RX: 4096
RX Mini: 0
RX Jumbo: 0
TX: 256
$ cat /etc/network/interfaces
# This configuration was created by the Security Onion setup script.
#
# The original network interface configuration file was backed up to:
# /etc/network/interfaces.bak.
#
# This file describes the network interfaces available on your system
# and how to activate them. For more information, see interfaces(5).
# loopback network interface
auto lo
iface lo inet loopback
# Management network interface
auto eth0
iface eth0 inet static
address 192.168.1.4
gateway 192.168.1.1
netmask 255.255.255.0
dns-nameservers 192.168.1.1
dns-domain localdomain
auto eth1
iface eth1 inet manual
up ip link set $IFACE promisc on arp off up
down ip link set $IFACE promisc off down
post-up ethtool -G $IFACE rx 4096; for i in rx tx sg tso ufo gso gro lro rxvlan txvlan; do ethtool -K $IFACE $i off; done
post-up echo 1 > /proc/sys/net/ipv6/conf/$IFACE/disable_ipv6
auto eth2
iface eth2 inet manual
up ip link set $IFACE promisc on arp off up
down ip link set $IFACE promisc off down
post-up ethtool -G $IFACE rx 4096; for i in rx tx sg tso ufo gso gro lro; do ethtool -K $IFACE $i off; done
post-up echo 1 > /proc/sys/net/ipv6/conf/$IFACE/disable_ipv6
auto eth3
iface eth3 inet manual
up ip link set $IFACE promisc on arp off up
down ip link set $IFACE promisc off down
post-up ethtool -G $IFACE rx 4096; for i in rx tx sg tso ufo gso gro lro; do ethtool -K $IFACE $i off; done
post-up echo 1 > /proc/sys/net/ipv6/conf/$IFACE/disable_ipv6
Jeff H
Jeff H
Doug Burks
Security Onion 14.04
replayed pcap
Snort does not alert (note that Snort log file shows TCP Gaps = 2)
Suricata does not alert
Bro logs EXE
Security Onion 12.04
same results as above
If I switch Suricata from PF_RING to AF_PACKET, it will alert properly.
This would seem to point to PF_RING, but I know we have lots of folks
using PF_RING with VLANs and I don't remember seeing or hearing about
this issue before.
Looking at the pcap in Wireshark, I see the following:
duplicate acks
TCP out-of-order
I wonder if something about your network is causing these issues which
in turn causes PF_RING to drop packets which results in Snort showing
TCP Gaps = 2 and not alerting?
Jeff H
Notes from my testing thus far:
Security Onion 14.04
replayed pcap
Snort does not alert (note that Snort log file shows TCP Gaps = 2)
Suricata does not alert
Bro logs EXE
Security Onion 12.04
same results as above
If I switch Suricata from PF_RING to AF_PACKET, it will alert properly.
This would seem to point to PF_RING, but I know we have lots of folks
using PF_RING with VLANs and I don't remember seeing or hearing about
this issue before.
Looking at the pcap in Wireshark, I see the following:
duplicate acks
TCP out-of-order
I wonder if something about your network is causing these issues which
in turn causes PF_RING to drop packets which results in Snort showing
TCP Gaps = 2 and not alerting?
But all of this was done a week or more after upgrading Security Onion and when the alerts for this SID stopped.
Jeff H
When I get a chance I will do a tcpdump on the traffic of a system with no vlan tagged traffic so we can see if it has the duplicate acks and TCP out-of-order as well.Jeff
Doug Burks
following Bucket Len (AKA Snap Length):
Snort - 1514
Suricata - 1516
Bro - 8192
I increased Snort's snaplen to 1518 in snort.conf, restarted Snort,
and it alerted on the traffic successfully.
For Suricata, I don't see a snaplen option in the pfring section of
suricata.yaml, so I increased the MTU of my sniffing interface as
follows:
sudo ifconfig eth1 mtu 1502
I then restarted Suricata, verified that PF_RING showed it with a
Bucket Len of 1518, replayed the traffic, and got an alert.
Can you test and confirm this on your installation?
Jeff H
I was doing some testing and noticed that PF_RING would report the
following Bucket Len (AKA Snap Length):
Snort - 1514
Suricata - 1516
Bro - 8192
I increased Snort's snaplen to 1518 in snort.conf, restarted Snort,
and it alerted on the traffic successfully.
For Suricata, I don't see a snaplen option in the pfring section of
suricata.yaml, so I increased the MTU of my sniffing interface as
follows:
sudo ifconfig eth1 mtu 1502
I then restarted Suricata, verified that PF_RING showed it with a
Bucket Len of 1518, replayed the traffic, and got an alert.
Can you test and confirm this on your installation?
Doug Burks
search for the Bucket Len of Suricata workers as follows:
grep -A20 "Suricata" /proc/net/pf_ring/*eth* |grep "Bucket Len"
My testing showed that Suricata would add 16 to the MTU of the
interface which is why I set my MTU to 1502 and then verified Bucket
Len of 1518. If that's not working for you, you might try setting MTU
to 1518.
Jeff H
What should the take away be from all of this?
Doug Burks
a new thread for further discussion and feedback.
> Follow Security Onion on Twitter!
> https://twitter.com/securityonion
> ---
Doug Burks
https://groups.google.com/d/topic/security-onion/94s7beFDMU0/discussion
Doug Burks

Browner 87
Currently - rules that don't require a stream work fine (testmyids.com triggers an alert every time without fail), but rules that require a proper stream do not fire (I get no alerts for downloading putty, I'm also hitting a website that should fire a "cloned site" rule or two, and I'm hitting a page that should trigger a MassScan alert that doesn't).
I'll say that I've already checked the obvious things too - the rules are for sure enabled, the engine is running and detects other things (like some P2P triggers).
I upped my MTU from 1500 to 1502, then to 1518, then to 9000, then to 1400 (just to see), restarting with "nsm_sensor_ps-restart" each time and none of those changes made any difference. I've also validated that "grep -A20 "Suricata" /proc/net/pf_ring/*eth* | grep "Bucket Len"" returns a number 16 higher than my MTU.
Is there anything else I can do to try to solve this? Otherwise I'll be forced to go back to 12.04 :(
In case it matters, I don't know if this is normal, I get a lot of SURICATA STREAM Packet with invalid ack and SURICATA STREAM SHUTDOWN RST invalid ack when I rapidly load/reload pages. I normally leave Suricata STREAM events turned off so I don't know if this is expected.
Doug Burks
Doug Burks
https://github.com/Security-Onion-Solutions/security-onion/wiki/VLAN-Traffic
Please feel free to add or modify as necessary.
Doug Burks