Re: [GSOC 2018][RubyPlot-GR][21 July 2018] Added Candlestick Plot, Extensive color list and Hex-string-Symbol Compatibility for all the plots
5 views
Skip to first unread message

Sameer Deshmukh
Jul 23, 2018, 9:07:01 AM7/23/18
to Pranav Garg, Prasun Anand, Arafat Khan, Pjotr Prins, John Woods, SciRuby Mailing List
Not bad! Did you update the rubyplot/specs with your latest changes?
I'm having a look at your code now.
Expecting more updates for Monday (today).
On 07/22/2018 02:22 AM, Pranav Garg
wrote:
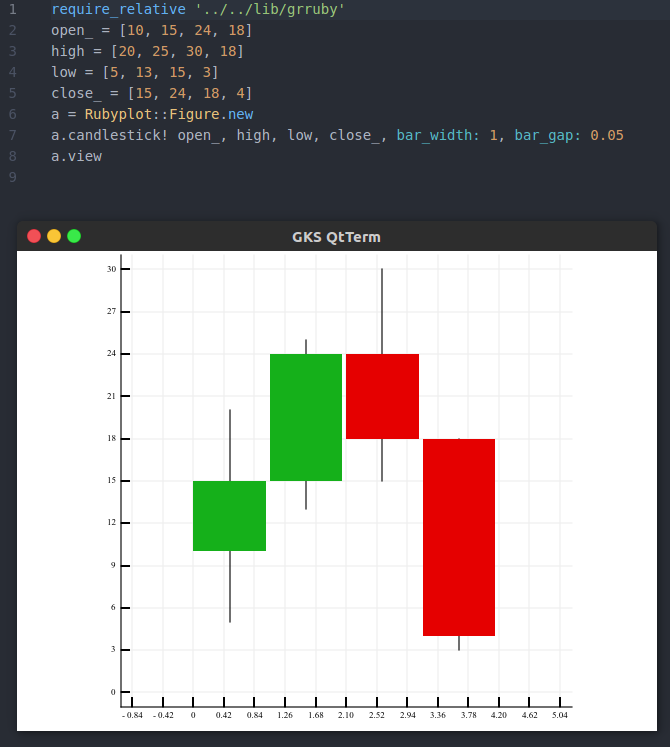
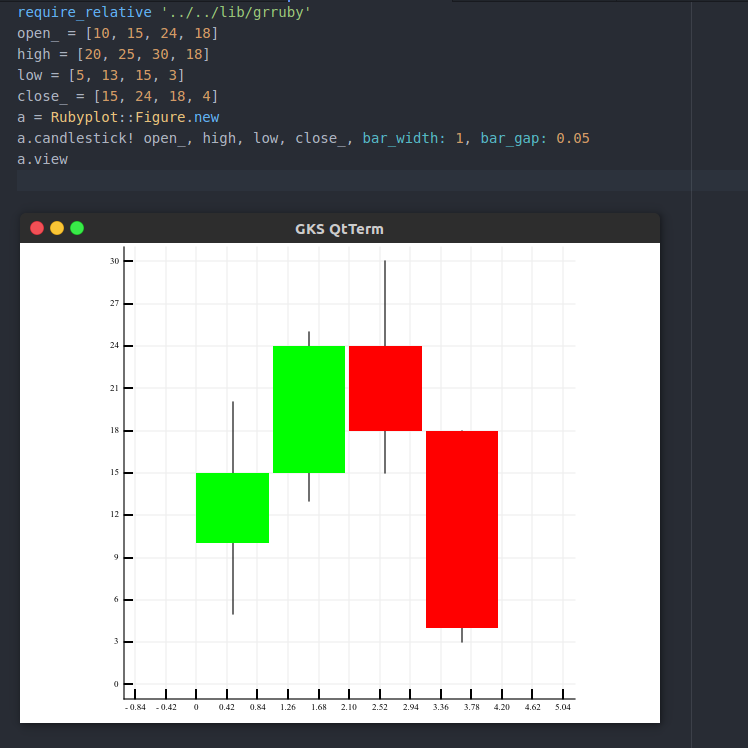
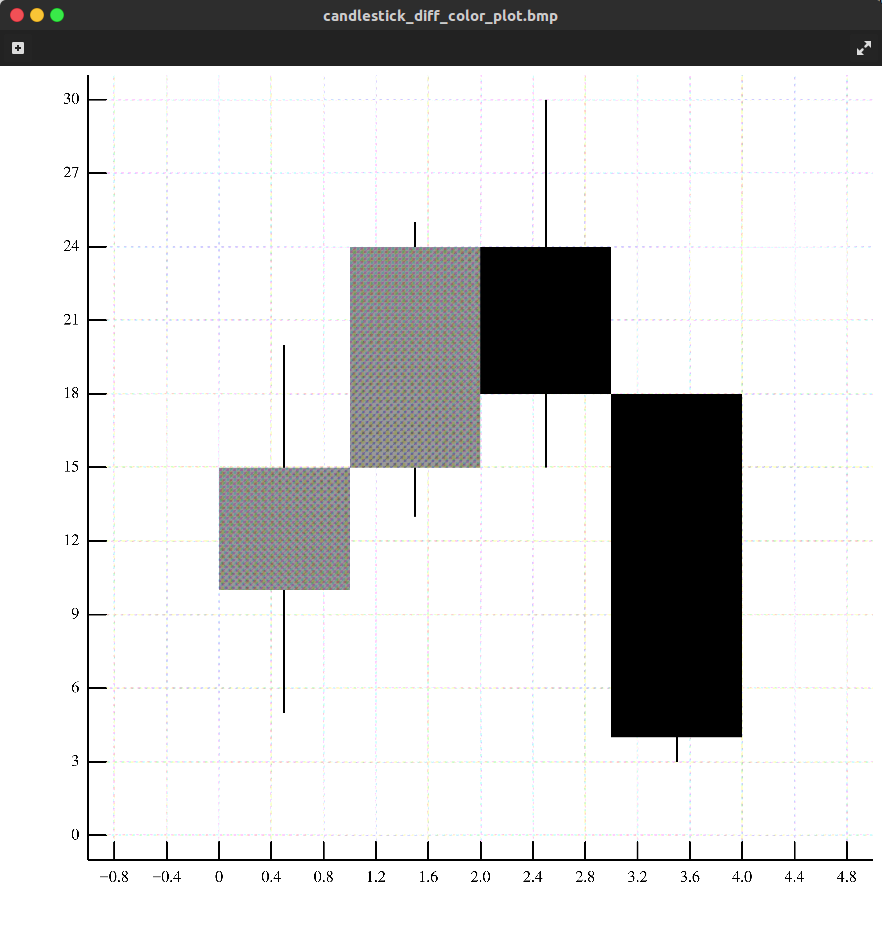
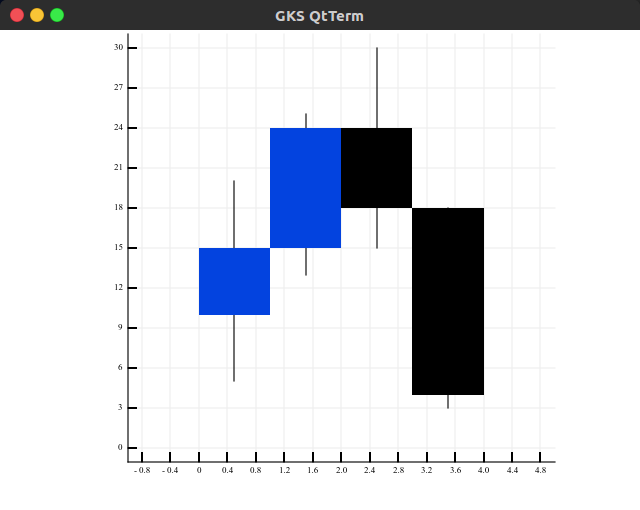
Hey guysToday I worked on the Candlestick plots. Check this out::
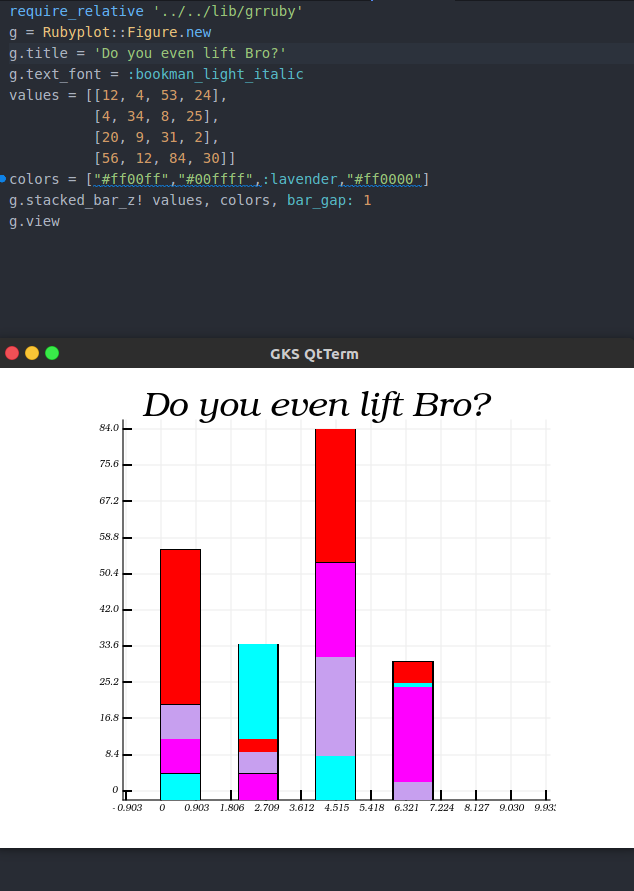
I also implemented a symbol based color index (thanks to xkcd) .Following Sameer and Arafat's suggestion. I worked on allowing both hex-strings and symbols for all the plots.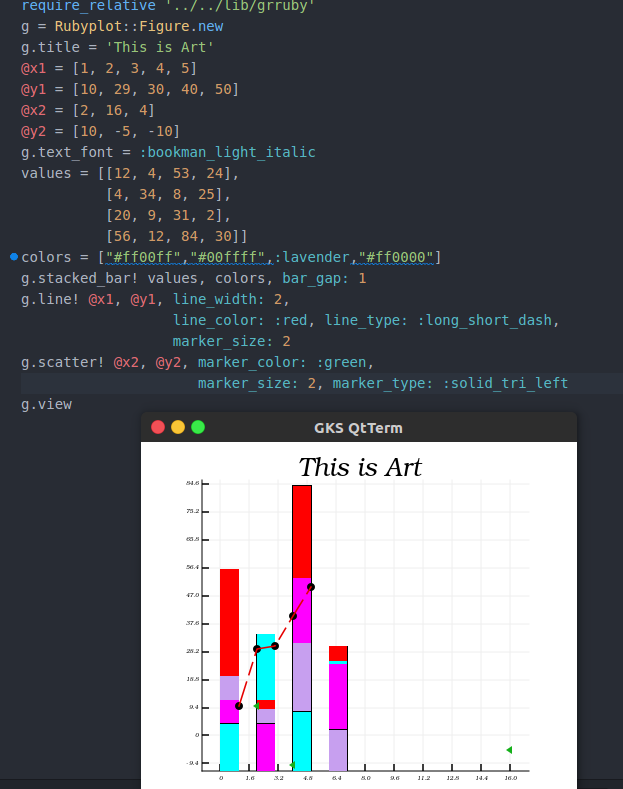
Because of the change in colors All my previous spec reference images are unusable so I will recreate them. For example the following was the Candlestick plot before I changed colors.
I also noticed that I was stacking the Stacked Bar plots by overlapping them in Z plane (By drawing the largest bar first and drawing other bars on top of it from the same base) rather than the Y plane.I will rename them to stacked_bar_z and also make a regular vanilla stacked plot.
I am setting the following goals for tomorrow:1. Make a vanilla stacked plot
2. Make a script to create all spec images3. updating specs4. work on legend and labeling axes5. Research for Subplots!!
I also realized that I forgot to put links to past few commits.
Please do comment on the commits if you get time as they provide me valuable feedback on what to change in the code and my practice.
RegardsPG
--
Regards,
Sameer Deshmukh

***********************************************
Master's degree student. Rio Yokota Lab.
Tokyo Institute of Technology, Japan.

Twitter : @v0dro
GitHub: @v0dro
Blog: http://v0dro.in
***********************************************

Pranav Garg
Jul 23, 2018, 1:48:28 PM7/23/18
to Sameer Deshmukh, John Woods, Prasun Anand, SciRuby Mailing List, Pjotr Prins
Today I made Vanilla Stacked graphs and rebranded the old ones as StackedGraphZ.
Here is the difference: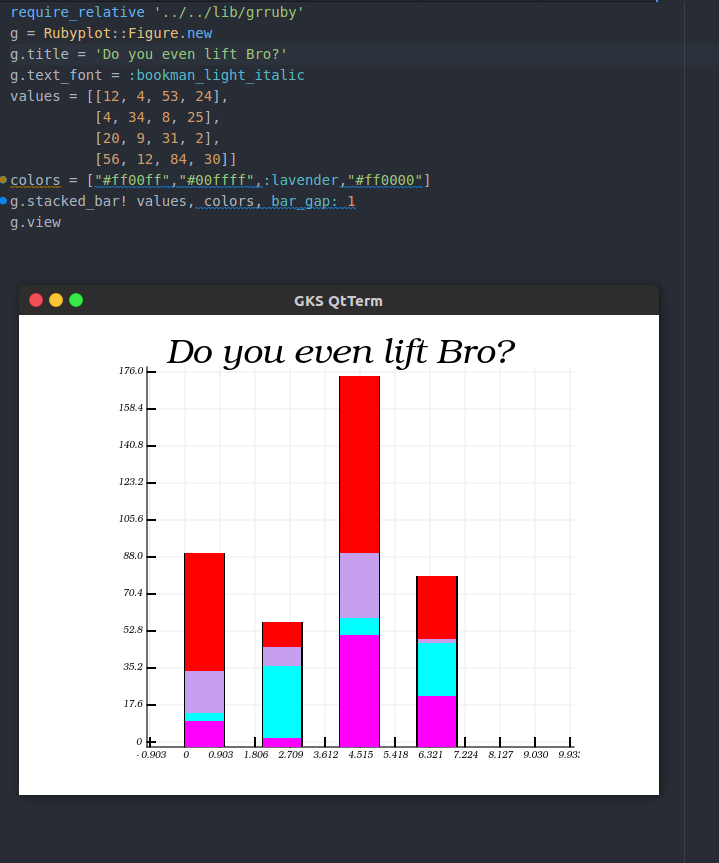

The images are created just fine when done individually.
I need to work on my specs (also taking into the loop the progress made on the main rubyplot specs)
I also added A list of 18 contrasting colors so that user does not need to define color for every data in stacked bar if they don't want to. This might be useful later in other graphs too.
I created a tinkered around with the rspec scripts to create reference images, however, they are creating glitchy images.
I worked on the axes labels, They are working fine in some cases and weird in others. Will have to debug it.
For Legend and Subplots I will have to figure out how they are implemented in GR.jl. in matplotlib the Axes functionality makes it easy to have legends and Subplots.
For tomorrow, I will focus on updating and creating Specs as well as reference images as well as working on the valuable suggestions on commits and the issues opened by Sameer.
Regards
PG
Regards
PG
Sameer Deshmukh
Jul 23, 2018, 9:53:52 PM7/23/18
to Pranav Garg, John Woods, Prasun Anand, SciRuby Mailing List, Pjotr Prins
Looks good.
Pranav Garg
Jul 24, 2018, 5:25:55 PM7/24/18
to Sameer Deshmukh, Prasun Anand, Arafat Khan, Pjotr Prins, John Woods, SciRuby Mailing List
Reply all
Reply to author
Forward
0 new messages