Bug in list_plot3d
13 views
Skip to first unread message

P Purkayastha
Apr 2, 2012, 1:36:59 AM4/2/12
to sage-...@googlegroups.com
Hi,
This is in relation to my earlier post in sage-support:
Essentially, list_plot3d was *adding* points when I had none in the graph. This is easily seen by trying to plot
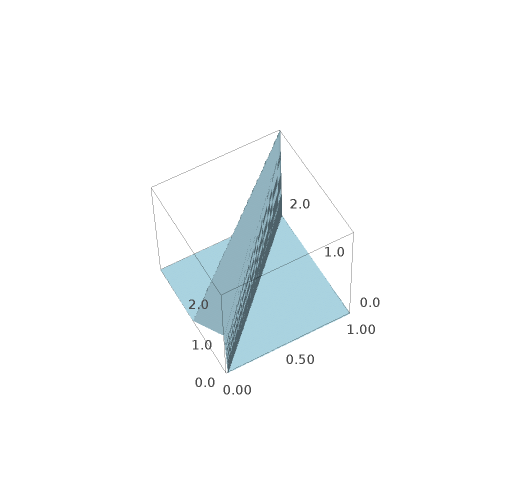
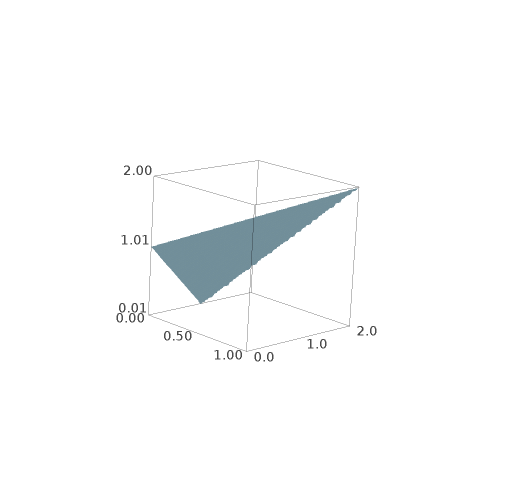
list_plot3d([(0,0,1), (1,2,2), (0,1,0)], num_points=100)
Looking through the file sage/plot/plot3d/list_plot3d.py, I realized that in line 296, the default value of one of the commands is set to 0:
T=delaunay.Triangulation(x,y)
f=T.nn_interpolator(z)
f.default_value=0.0
f=T.nn_interpolator(z)
f.default_value=0.0
By default this takes a value of nan. Is there a reason why this was reset to zero? The default plot clearly makes no sense at all (see original_line_296.png), compared to not setting f.default_value to 0 (see commented_line_296.png).
Reply all
Reply to author
Forward
0 new messages