timeit for mathematicians

William Stein
I was just looking at some timings for trac 12149, and it occurred to
me that our "timeout" command may be fine for programmers, but for us
mathematicians surely we want something that gives a better measure of
the distribution of timings? Wouldn't it be nice to get both the mean
and standard deviation of the trials, rather than just the mean?
I'm guessing I'm not the first person to think of this, so maybe one
of the people reading this has already written some code for this?
I'm curious what people would think about the timeit command being
improved a bit as follows:
(1) by default it returns/displays the mean and standard deviation.
This way we can more easily compare timings between different runs or
different code. If the standard deviation were "10 ms", say, and two
timings differ by 2 ms, we know that it means little.
(2) Timeit would return an object that prints itself as in 1. But
it would also have a plot_histogram method, which would return a
histogram plot of all the timings from the runs. Also, there would
be methods on this object to return the timing as a float in seconds,
etc. It could also give access to both wall and cputimes, since both
are very relevant for Sage (which uses pexpect sometimes).
Thoughts? Are there any experts out there in code benchmarking done
from a more mathematically sophisticated perspective than just one
number? It's entirely possible I'm making some stupid mistake in
suggesting the above.
William
--
William Stein
Professor of Mathematics
University of Washington
http://wstein.org

Jason Grout
How about a method to compare itself to another timeit object and tell
if there is a statistically significant difference for a certain
p-value? We could even embed this in "<" and ">" comparison logic.
Jason

Nils Bruin
indeed, quoting from
http://docs.python.org/library/timeit.html
we find:
"""
Note
It’s tempting to calculate mean and standard deviation from the result
vector and report these. However, this is not very useful. In a
typical case, the lowest value gives a lower bound for how fast your
machine can run the given code snippet; higher values in the result
vector are typically not caused by variability in Python’s speed, but
by other processes interfering with your timing accuracy. So the min()
of the result is probably the only number you should be interested in.
After that, you should look at the entire vector and apply common
sense rather than statistics.
"""
William Stein
I now remember that too. However, I take that as the sort of typical
thing an engineer who doesn't really understand statistics might say.
They are concerned about outliers and the data not being normally
distributed.
The fact is that in practice the bound got from "the lowest value
gives a lower bound" itself various by quite a bit between calls to
timeit. Should one just keep taking minimums?
Given that processors are not deterministic and do speculative
execution of instructions, etc., I'm even more dubious about the above
quote.
I've thrown Bill Hart in the cc, since he must have worried a lot
about exactly this question when trying to make low level C/assembly
code fast.
-- William

Nathann Cohen
we find:
Would really make sense to find out how this method reacts to random instances.
William Stein
That's a great point! There's certainly many examples of
nondeterministic code in Sage (e.g., in linear algebra algorithms like
Hermite Normal Form), and it would be great to have a good way to
benchmark it. Instead of saying "this function sometimes takes 5
seconds", you would get a much better sense of how it does when trying
different random strategies.
-- William

Simon King
Currently, "timeit" often does not more than finding the "best of
three". I suspect that computing a standard deviation from just three
samples is not quite reliable. Hence, if one wants to get a statistic
then one needs a lot more runs, thus, the test will take much more
time.
Do we want that "timeit" will take much more time *by default*?
Perhaps one could keep "timeit" as it is and introduce a new object
"time_statistics" (say), that collects timings and may add additional
data points, if the user so wish?
For example:
sage: s="some code to be tested"
sage: TS = time_statistics(s, number=10000)
sage: TS
10000 runs per sample
3 samples in total
Mean: 451 ns
Standard deviation: 103 ns
The parameter "number" is supposed to have the same meaning (and the
same default) as for timeit: It is the number of repetitions of the
code string forming one data point.
Since three samples (or whatever the default should be) is not enough,
we wish to add samples:
sage: TS.additional_samples(15)
sage: TS
10000 runs per sample
18 samples in total
Mean: 446 ns
Standard deviation: 17 ns
And of course TS has methods returning these (and other) statistical
data.
I guess that is similar to what William is suggesting for the "timeit"
command; but I think "timeit" (for fast tests) and
"time_statistics" (for detailed but more time consuming tests) should
be separated.
Cheers,
Simon

Bill Hart
For low level assembly language we sometimes compute the exact number
of cycles using the cycle counter rather than do a timing. This varies
per architecture and assumes cache affects are not relevant.
For C we (used to) take many iterations and compute minimum and
maximum times. If the two are close and the number of iterations is
high and the machine is not under load, your problem is solved. If any
of those conditions is not met (and sometimes if you do) then you may
not know as much as you believe you do. Things like processors in
power saving mode or variations in the speed of processors on your
cluster may cause massive variations or even just meaningless timings.
If you are timing Python then your timing may be wildly affected by
the choice of language. :-)
Bill.

Martin Albrecht
> Thoughts? Are there any experts out there in code benchmarking done
> from a more mathematically sophisticated perspective than just one
> number? It's entirely possible I'm making some stupid mistake in
> suggesting the above.
Carlo Wood implemented pretty nice benchmarketing code for us in M4RI
https://bitbucket.org/malb/m4ri/src/ec6d607ba523/testsuite/benchmarking.c
* Example usage:
*
* ./bench_elimination -s 0 -m 4 -c 90 -a 0.005 -d -t 30 -n 1000 1000 1000
*
* would run at most 30 seconds (-t) or 1000 times (-n), whichever comes
* first, or stop after the real average of wall time (-s 0) falls with 90%
* certainty (-c) in a range that is +/- 0.005 times the observed mean (-a:
* accuracry), but no sooner than that at least 4 (-m: minimum) measurements
* have been done. It would also print (-d: dump) each measurement
* (0:microseconds
* 1:cpuclocks).
It uses the "Student-t" method to estimate the certainty (don't ask me what
that is, I don't know).
Cheers,
Martin
--
name: Martin Albrecht
_pgp: http://pgp.mit.edu:11371/pks/lookup?op=get&search=0x8EF0DC99
_otr: 47F43D1A 5D68C36F 468BAEBA 640E8856 D7951CCF
_www: http://martinralbrecht.wordpress.com/
_jab: martinr...@jabber.ccc.de

Florent Hivert
> For low level assembly language we sometimes compute the exact number
> of cycles using the cycle counter rather than do a timing. This varies
> per architecture and assumes cache affects are not relevant.
I remember doing that on a 6502 or 8086/80286/80386. I'm curious: Is it still
really doable on modern processors with deep pipeline, multiple execution
units, micro-instructions, branch predictions, hyperthreading, and I'm
certainly forgetting some more ?
Cheers,
Florent

Volker Braun
It uses the "Student-t" method to estimate the certainty
William Stein
At least since we're mathematically savvy, we know that there's a lot
more to statistics than the normal distribution.
Having never seen any timing distributions (since they are hidden by
timeit), I don't even know anything about how timings are distributed
in practice. I wouldn't mind seeing a frequency histogram or trying
tests like Kolmogorov–Smirnov to decide for myself...
-- william
William
Nils Bruin
> At least since we're mathematically savvy, we know that there's a lot
> more to statistics than the normal distribution.
>
> Having never seen any timing distributions (since they are hidden by
> timeit), I don't even know anything about how timings are distributed
> in practice. I wouldn't mind seeing a frequency histogram or trying
> tests like Kolmogorov–Smirnov to decide for myself...
You made timeit hide that data! A simple refactoring makes it
available again. See
http://trac.sagemath.org/sage_trac/ticket/12153
With the patch there you can do:
sage:
T=sage.misc.sage_timeit.sage_timeit("factorial(100)",globals(),repeat=20)
sage: stats.median(T.series)
9.8094940185546871e-07
sage: stats.variance(T.series)
9.7986974709017813e-13
William Stein
On Dec 14, 2011 12:40 AM, "Nils Bruin" <nbr...@sfu.ca> wrote:
>
> On Dec 13, 11:27 pm, William Stein <wst...@gmail.com> wrote:
> > At least since we're mathematically savvy, we know that there's a lot
> > more to statistics than the normal distribution.
> >
> > Having never seen any timing distributions (since they are hidden by
> > timeit), I don't even know anything about how timings are distributed
> > in practice. I wouldn't mind seeing a frequency histogram or trying
> > tests like Kolmogorov–Smirnov to decide for myself...
>
> You made timeit hide that data! A simple refactoring makes it
> available again. See
> http://trac.sagemath.org/sage_trac/ticket/12153
Nice. Obviously I owe it to referee this. Thanks!
>
> With the patch there you can do:
>
> sage:
> T=sage.misc.sage_timeit.sage_timeit("factorial(100)",globals(),repeat=20)
> sage: stats.median(T.series)
> 9.8094940185546871e-07
> sage: stats.variance(T.series)
> 9.7986974709017813e-13
>
> --
> To post to this group, send an email to sage-...@googlegroups.com
> To unsubscribe from this group, send an email to sage-devel+...@googlegroups.com
> For more options, visit this group at http://groups.google.com/group/sage-devel
> URL: http://www.sagemath.org

Harald Schilly
On Wednesday, December 14, 2011 2:36:24 AM UTC+1, Volker Braun wrote:
Martin Albrecht
I should mention that we do test random matrices and that some of our
algorithms depend on the input (e.g., they are rank sensitive). So perhaps at
least for some tests we run, it makes a bit of sense? But we should at least
also output the minimum as well I guess.

Harald Schilly
<martinr...@googlemail.com> wrote:
> I should mention that we do test random matrices and that some of our
> algorithms depend on the input (e.g., they are rank sensitive). So perhaps at
> least for some tests we run, it makes a bit of sense? But we should at least
> also output the minimum as well I guess.
What comes to my mind here are the quantiles. E.g. sort your timings
by value, split them into 4 parts and output the 5 values where the
splits occur. The first one is the min, the last one the max, and the
one in the middle where most of the timings are. Nice plots of it are
called box-plots. This captures everything more accurately than the
min/mean/sd scheme. (The reason why quantiles aren't used that much in
the past is just that sorting is much harder than sum+division.)
H

Fernando Perez
> Nice plots of it are
> called box-plots. This captures everything more accurately than the
> min/mean/sd scheme. (The reason why quantiles aren't used that much in
> the past is just that sorting is much harder than sum+division.)
A nice summary of all things boxplots:
http://vita.had.co.nz/papers/boxplots.html
Cheers,
f

rjf
(a) the algorithm + algorithm must be deterministic (no calls to
"random")
(b) the computation might be slow because of multiprocessing (time
slots scheduled to something else)
but also there are other often quite critical issues affecting
timing, like:
(c) cache loading / memory interference. The second or subsequent
runs may be way faster because all the data and program are now in
cache. Is this fair?
(d) garbage collection (assuming you are using one of them). Time may
be slow because one run includes GC processing.
People timing Lisp programs sometimes induce a GC just before a timing
run.
Of course if the GC causes an additional allocation of memory, the
next GC is different etc.
I assume there are ways of counting instructions executed (or byte-
code interpreted) that
may be useful in comparing algorithms that are essentially running in
the same environment.
This does not mean that the relative speeds will be the same in other
environments.
RJF
William Stein
What were you timing?
> H
>
>
> --
> To post to this group, send an email to sage-...@googlegroups.com
> To unsubscribe from this group, send an email to
> sage-devel+...@googlegroups.com
> For more options, visit this group at
> http://groups.google.com/group/sage-devel
> URL: http://www.sagemath.org
--
Harald Schilly
>
> What were you timing?
>
well, it's in the attached sage file, nothing serious:
factor(2**111-1), 10 inner loops and 200 repetitions.
if you have a better example to test, go ahead or tell me :)
H
Harald Schilly
> I hacked something together that plots a histogram...
I made a second version, that uses the timeit command directly and
scales the x-axis manually (i.e. including the 0)
It just times the factor function, but feel free to edit the .sage file!
H
Jason Grout
You could also use http://trac.sagemath.org/sage_trac/ticket/9671. It
would be great to finish that ticket.
Thanks,
Jason
William Stein
One heads up here -- many factoring algorithms are nondeterministic.
They proceed by trying, via some heuristic, one of a million different
options, and many of those involve doing something random and hoping
to somehow find a factor.
If you do "factor(2**111-1, verbose=4)" or "factor(2**111-1,
verbose=8)" you'll see that randomized algorithms such as Pollard rho
[1] are used for factoring that number.
[1] http://en.wikipedia.org/wiki/Pollard's_rho_algorithm
I remember back in 1996 or so when I was comparing the speed of
various computers I would always try to factor some large integer in
PARI on each machine. At some point I realized this was not the best
way to benchmark something.
Sometimes these days I'll compute factorial(10^7), say, which tests
something about MPIR at least.
William
>
> H
>
> --
> To post to this group, send an email to sage-...@googlegroups.com
> To unsubscribe from this group, send an email to sage-devel+...@googlegroups.com
> For more options, visit this group at http://groups.google.com/group/sage-devel
> URL: http://www.sagemath.org
--
William Stein
>
> On Dec 14, 2011 12:40 AM, "Nils Bruin" <nbr...@sfu.ca> wrote:
>>
>> On Dec 13, 11:27 pm, William Stein <wst...@gmail.com> wrote:
>> > At least since we're mathematically savvy, we know that there's a lot
>> > more to statistics than the normal distribution.
>> >
>> > Having never seen any timing distributions (since they are hidden by
>> > timeit), I don't even know anything about how timings are distributed
>> > in practice. I wouldn't mind seeing a frequency histogram or trying
>> > tests like Kolmogorov–Smirnov to decide for myself...
>>
>> You made timeit hide that data! A simple refactoring makes it
>> available again. See
>> http://trac.sagemath.org/sage_trac/ticket/12153
>
> Nice. Obviously I owe it to referee this. Thanks!
OK, I looked at it and realized that your patch wasn't close to
something that needed review. So I added the obvious necessary
examples, fixed the big bug, etc. So can you (or anybody) please,
please review it?
http://trac.sagemath.org/sage_trac/ticket/12153
William

AndrewVSutherland
some sort of power-saving mode that will be in use by default. This
means that if the CPU is not fully loaded when you start your test,
it will take some time (typically not more than a few seconds) for it
to ramp up to full speed (ironically, this often means your test may
run faster when it is running on a busy system than on an idle one).
You may get a very misleading distribution of timings if you don't
take
this in to account, e.g. by including some ``warm-up" code that runs
before you start timing (this is what I do in my own tests), or by
ignoring any timings in the first few seconds.
Actually, more meaningful than a min, max, mean, or standard
deviation is probably the lim inf and lim sup -- you really want to
see what the timings are converging to (if anything).
Drew
Harald Schilly
<andrewvs...@gmail.com> wrote:
> e.g. by including some ``warm-up" code that runs
> before you start timing
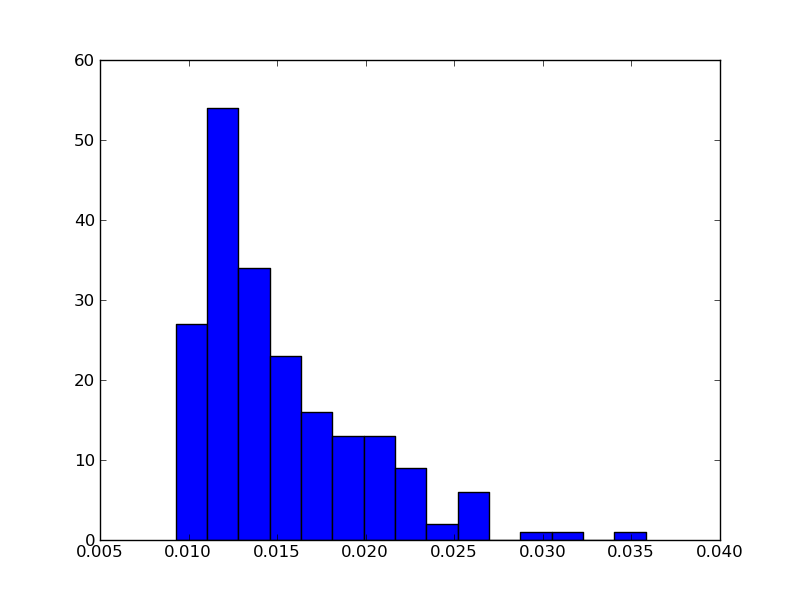
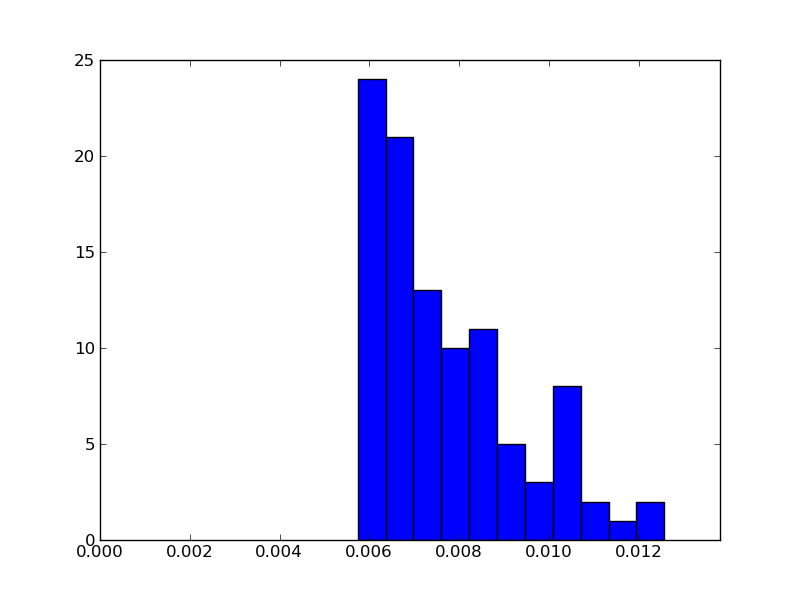
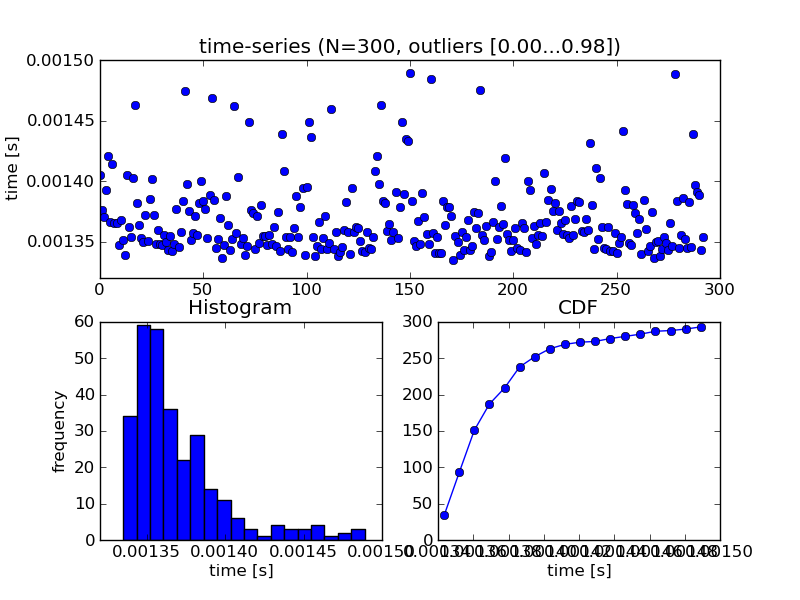
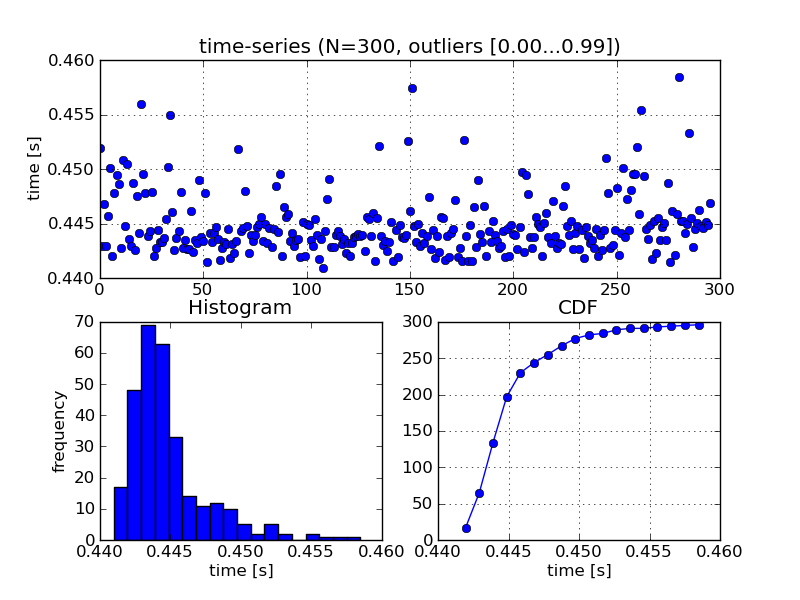
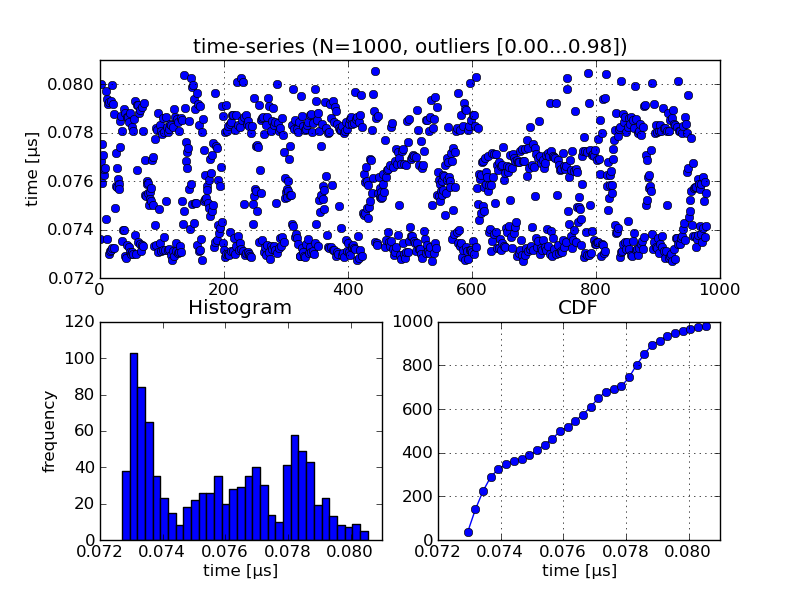
that's a good idea! next to the histogram i did above, i also want to
plot the time-series. this should show this or other trends.
h
Harald Schilly
On Thursday, December 15, 2011 1:06:57 AM UTC+1, William wrote:
One heads up here -- many factoring algorithms are nondeterministic.
William Stein
On Dec 16, 2011 9:25 AM, "Harald Schilly" <harald....@gmail.com> wrote:
>
>
>
> On Thursday, December 15, 2011 1:06:57 AM UTC+1, William wrote:
>>
>> One heads up here -- many factoring algorithms are nondeterministic.
>
>
> Hi, thank's for pointing this out! But I think at that point one has to ask what one wants to measure. The computer-raw-performance, or the algorithmic-behavior-performance, ... or maybe something else. What I mean is, even if the factor algorithm is non-deterministic, it might be very interesting to know how it is distributed. I can think of this like checking how often it is "fast" and how often it misses it and is "slower". (or if it is smooth and everything is fine). [or maybe I'm just too naive to ask these kind of questions :) ]
>
I strongly agree with this. In much of number theory one deals with nondeterministic algorithms and expected runtime, worst case, etc. Having timing code that supports this well will be awesome!
> However, I'm aware of this ticket to expose the timeit samples, but I continued improving the script I worked on. I also used it to time this "<float> == <float>" that emerged in the ticket 12149 you mentioned in the first email. I also did a third plot for factorial(10^6).
>
> The script does a lot more now:
>
> * shows the time-series, this is nice to see if there are certain trends over time (i.e. it starts slow and gets faster, slower in the end, bumps, ...)
>
> * besides the histogram it also shows the CDF, that's also quite useful. I asked someone with a statistics background, the distribution looks like the log-normal distribution. that sounds sensible: http://en.wikipedia.org/wiki/Log-normal_distribution
> (but it's definitely not always the case)
>
> * it does some optional outlyer rejection by quantiles. you have to enter a range for upper and lower margins of two quantiles, then it rejects values outside. this is nice, because this behaves independently of the number of samples!
>
> * warmup phase: at the beginning, it runs for some seconds just to get started
>
> attached are three plots, filenames indicated what they display.
>
> I suggest that I open a ticket so that this isn't lost, or is there already a ticket for that kind of analysis?
>
Do it!
> I also let it run on sagenb.org, setting the interpreter to "python". There it looks quite differently and not so homogeneous over time:
> http://sagenb.org/home/pub/3857/
>
> harald
>
Harald Schilly

Nicolas M. Thiery
> done, it's here: http://trac.sagemath.org/sage_trac/ticket/12168
Speaking of timing code, one tool I have been dreaming about for a
while is:
sage: def random_data(n):
...
sage: def my_algorithm(data):
...
sage: C = complexity_analysis(my_algorithm, data = build_data)
Running my_algorithm on data of size 1
Running my_algorithm on data of size 2
Running my_algorithm on data of size 4
...
sage: C # worst case complexity estimate
O(n^2.32)
sage: C.average() # average complexity estimate
O(n^2.32)
sage: C.run(3600) # gather more data for one hour
...
Running my_algorithm on data of size 128
...
sage: C
O(n^3.001)
sage: C.plot() # shows a nice worst case time plot
sage: C.average().plot() # shows a nice average time plot
Cheers,
Nicolas
--
Nicolas M. Thi�ry "Isil" <nth...@users.sf.net>
http://Nicolas.Thiery.name/

David Roe
wishlist as well.
David
> Nicolas M. Thiéry "Isil" <nth...@users.sf.net>
> http://Nicolas.Thiery.name/
William Stein
Tom Boothby's did something much like this once...