asking how to make chromosome name become easy to distinguish
32 views
Skip to first unread message

amira ndi
Sep 9, 2021, 11:59:42 AM9/9/21
to R/qtl discussion
Dear all,
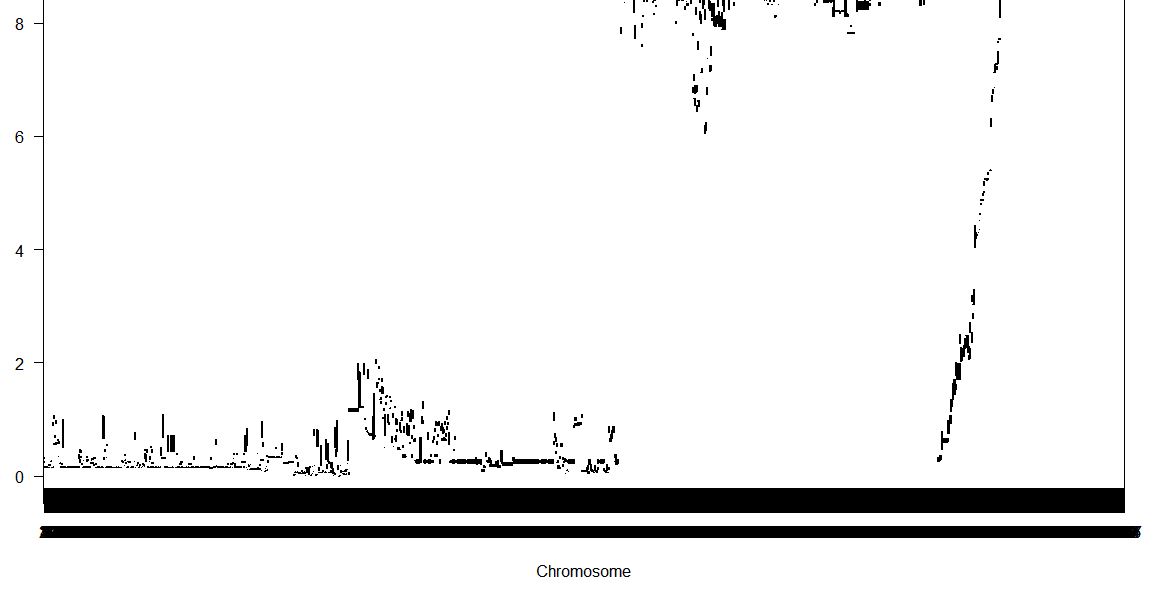
I need some advice and suggestion due to my problem, I am sorry if this question seems easy but I am beginner here to use r/qtl packages in R software. I have around 1000 markers (genotype) and 1 phenotype (100 data). I tried to run it used scannone with methode "mr"
However the data showed like this,
Here is my scripts,
library(qtl)
data_mr <- read.csv("trial2.csv")
data_mr <- read.cross("csvr", file="trial2.csv", estimate.map=FALSE)
data_mr <- jittermap(data_mr, amount= .0001)
data_mr <- calc.genoprob(data_mr, step=0,eror.prob=0.01)
data.scanone <- scanone(data_mr, pheno.col = 1)
permulation.test <- scanone(data_mr, method = "em",
pheno.col = 1, n.perm=10)
plot(data.scanone)
I only have genotype data like "AA/BB" and do not have position of marker in cM. Are there any ways to make the chromosome name could be easy to distinguish? or do I have a mistake to input the data?
Thank you so much before.

Karl Broman
Sep 9, 2021, 12:09:19 PM9/9/21
to R/qtl discussion
R/qtl assumes a set of chromosome IDs for the markers, and really needs marker order and cM locations to handle missing data properly. If you just want to do GWAS with the observed SNPs, you may be better off with more general software like PLINK.
The input file expects that the second row (or 2nd column if you're using the "csvr" format) contain the chromosome IDs.
See chapter 2 of the R/qtl book (https://rqtl.org/book/rqtlbook_ch02.pdf) and the sample data files at https://rqtl.org/sampledata/
karl
amira ndi
Sep 9, 2021, 12:26:36 PM9/9/21
to rqtl...@googlegroups.com
Dear Karl,
Thank you for answering.
Yes, my data does not have "cM location". Does it mean that I can not use QTL in Rstudio to estimate the genomic regions in my data?
Because, I want to estimate the location here. Any other suggestion that could be used to still analyze my data in R?
Thanks
Best
Amira
--
You received this message because you are subscribed to a topic in the Google Groups "R/qtl discussion" group.
To unsubscribe from this topic, visit https://groups.google.com/d/topic/rqtl-disc/NJeIyv7WAa8/unsubscribe.
To unsubscribe from this group and all its topics, send an email to rqtl-disc+...@googlegroups.com.
To view this discussion on the web visit https://groups.google.com/d/msgid/rqtl-disc/29843d0e-e2c0-4f28-b8c3-404d7d035746n%40googlegroups.com.
Karl Broman
Sep 9, 2021, 1:48:32 PM9/9/21
to R/qtl discussion
If you have a physical map with bp locations, I would start with that, though using Mbp positions.
Otherwise, you could try to estimate a genetic map. See https://rqtl.org/tutorials/geneticmaps.pdf
karl
amira ndi
Sep 18, 2021, 1:42:13 PM9/18/21
to R/qtl discussion
Dear Karl,
Thank you for your suggestion.
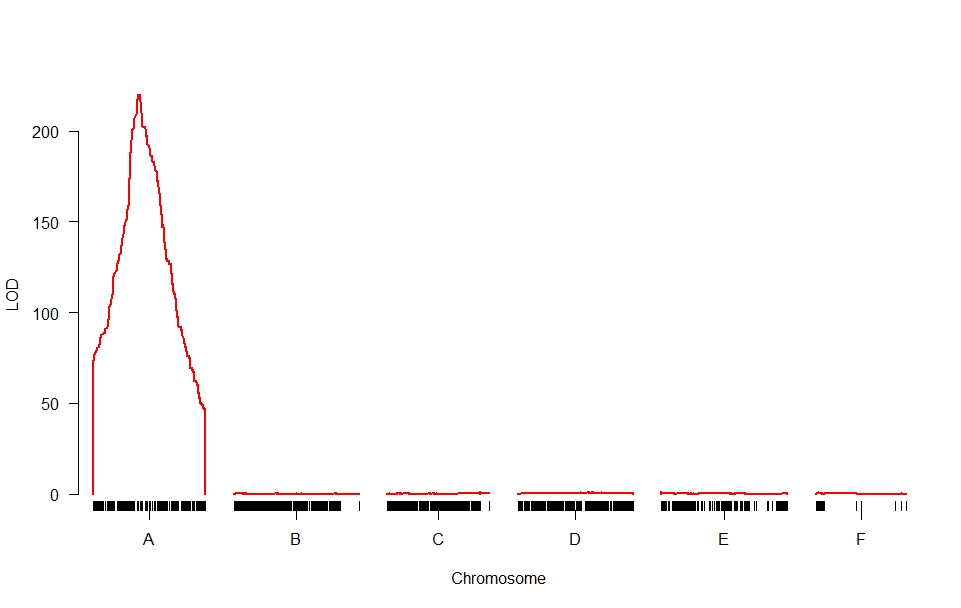
I would like to make the visual of my data like this,
I am still struggling to look for how to group the data in Excel so that it can be visualized per-chromosome like the picture above and what is the packages to analyze.
Do you have recommendation? My data consist of 1 phenotype (around 100 data) with 1000 markers (5 chromosomes).
Please give me your suggestion.
Thank you!
Best,
Amirandi
Karl Broman
Sep 18, 2021, 3:45:33 PM9/18/21
to R/qtl discussion
I don't have anything to add over what I said below. Chapter 2 of the R/qtl book talks about data file format, and it's available online at https://rqtl.org/book/rqtlbook_ch02.pdf
There are example data files online at https://rqtl.org/sampledata
karl
Reply all
Reply to author
Forward
0 new messages