How to troubleshoot slow Gerrit responses?
1,937 views
Skip to first unread message

tsuna
Oct 14, 2016, 7:02:07 PM10/14/16
to Repo and Gerrit Discussion
Hi there,
So I loaded the JMX metrics plugin and Javamelody, and neither really helped me pinpoint the source of my ailment. Loading a review page (e.g. http://gerrit/#/c/1234/) is particularly painful. I have one that is consistently super slow, taking on the order of a minute to load. It’s a fairly small change affecting just 5 files but it’s on its 79th patchset (just in case this matters, although I’ve seen other cases where there were only 2 patchsets and yet loading the review page was taking a lot of time).
Looking in the developer tools in Chrome, I noticed that it’s always the same query that takes up all the time: /changes/<XXX>/revisions/<sha1-here>/files?reviewed – and these queries all show up at the top of the request list in Javamelody’s table sorted by mean time.
If I replay the query using cURL, I always get a response from Gerrit in 40 to 60 seconds.
$ time curl -v 'http://gerrit/changes/XXX/revisions/sha1/files?reviewed' -H 'Accept-Encoding: gzip, deflate, sdch' -H 'Accept: application/json' -H 'Cookie: JSESSIONID=xxx; GerritAccount=xxx; XSRF_TOKEN=xxx' -H 'Connection: keep-alive' -H 'X-Gerrit-Auth: xxx' --compressed
* About to connect() to gerrit port 80 (#0)
* Trying 172.24.0.100... connected
* Connected to gerrit (172.24.0.100) port 80 (#0)
> GET /changes/XXX/revisions/sha1/files?reviewed HTTP/1.1
> Host: gerrit
> Accept-Encoding: gzip, deflate, sdch
> Accept: application/json
> Cookie: JSESSIONID=xxx; GerritAccount=xxx; XSRF_TOKEN=xxx
> Connection: keep-alive
> X-Gerrit-Auth: xxx
--
Benoit "tsuna" Sigoure
>
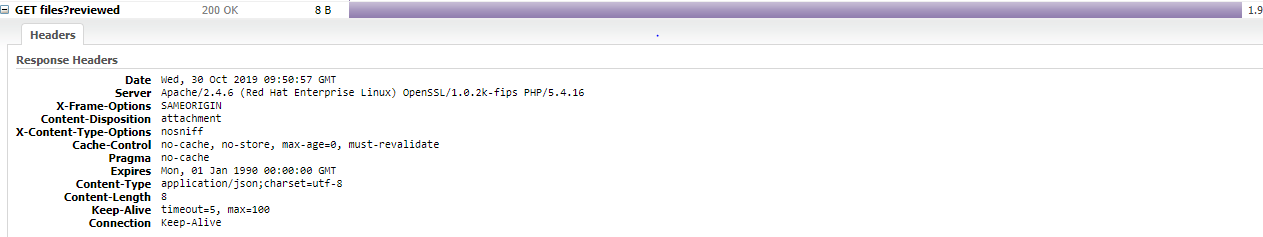
< HTTP/1.1 200 OK
< Date: Fri, 14 Oct 2016 22:35:36 GMT
< Content-Disposition: attachment
< X-Content-Type-Options: nosniff
< Cache-Control: no-cache, no-store, max-age=0, must-revalidate
< Pragma: no-cache
< Expires: Mon, 01 Jan 1990 00:00:00 GMT
< Content-Type: application/json; charset=UTF-8
< Content-Length: 8
<
)]}'
[]
* Connection #0 to host gerrit left intact
* Closing connection #0
curl -v -H 'DNT: 1' -H 'Accept-Encoding: gzip, deflate, sdch' -H -H -H -H 0.00s user 0.01s system 0% cpu 1:07.36 total
What tools do I have at my disposal to try to track down where the problem is?
We’ve had this Gerrit install for well over two years and we’ve been pretty happy with it, but recently performance has been abysmal. I was initially suspecting the MySQL backend, but Javamelody doesn’t show any query taking more than a second, with mean query times around 43ms with a standard deviation of 117ms.
I’m using Gerrit 2.13.1 (with Oracle JDK 8) with the following plugins:
| Plugin Name | Settings | Version | Status | |
| commit-message-length-validator | v2.13.1 | Enabled | ||
| download-commands | v2.13.1 | Enabled | ||
| gitblit | 2.13.171.0 | Enabled | ||
| hooks | v2.13.1-3-gc474972-dirty | Enabled | ||
| javamelody | v2.13 | Enabled | ||
| metrics-reporter-jmx | e2ce0ba | Enabled | ||
| reviewers-by-blame | bb48e5c | Enabled | ||
| reviewnotes | v2.13.1 | Enabled |
The machine’s cores are generally 80% idle in aggregate and iostat shows that the underlying 3-HDD soft-RAID5 array, while generally busy, has some spare IO capacity left. The Gerrit process takes generally 1-3% of the CPU with occasional short-lived bursts, nothing out of the ordinary. Its RSS is 2.3GB, which is also reasonable by Java standards. The machine has 2.4GB of RAM free plus 12GB in the page cache (total memory size is 64GB). It’s not a VM, so no hypervisor shenanigans possible.
--
Benoit "tsuna" Sigoure

Luca Milanesio
Oct 14, 2016, 7:23:34 PM10/14/16
to tsuna, Repo and Gerrit Discussion
Can you share your JavaMelody HTTP response time graph & table?
e.g. /monitoring?part=graph&graph=httpMeanTimes
Our slowest HTTP call is 19s, but only because of the sluggish performance of GitHub API.
Luca.
--
--
To unsubscribe, email repo-discuss...@googlegroups.com
More info at http://groups.google.com/group/repo-discuss?hl=en
---
You received this message because you are subscribed to the Google Groups "Repo and Gerrit Discussion" group.
To unsubscribe from this group and stop receiving emails from it, send an email to repo-discuss...@googlegroups.com.
For more options, visit https://groups.google.com/d/optout.
tsuna
Oct 14, 2016, 7:44:11 PM10/14/16
to Luca Milanesio, Repo and Gerrit Discussion
Not sure which table you’re referring to, I only see a graph at that URL, and here it is:
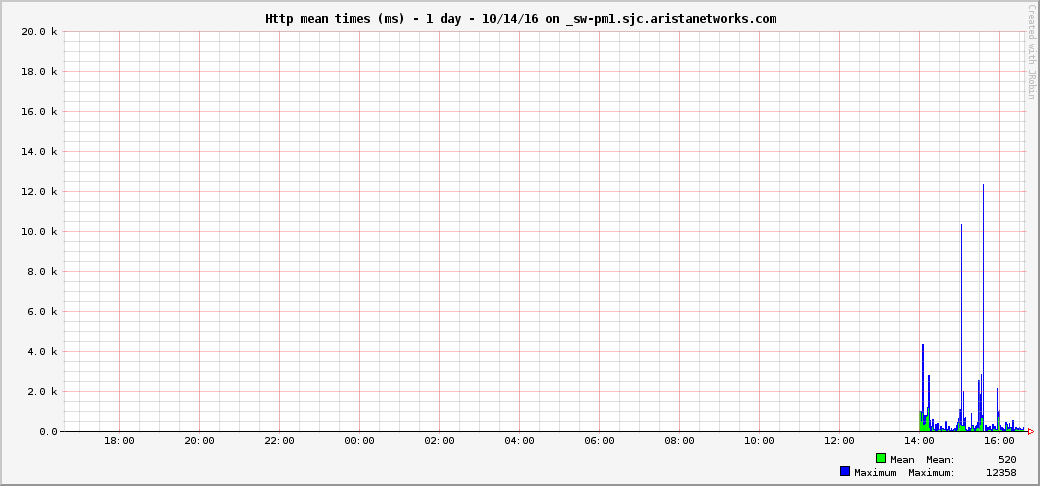
![]()
Not a pretty picture :P
Is there a way to turn on additional logging that would reveal where time is being spent when this API call is served?
--
--
To unsubscribe, email repo-discuss+unsubscribe@googlegroups.com
More info at http://groups.google.com/group/repo-discuss?hl=en
---
You received this message because you are subscribed to the Google Groups "Repo and Gerrit Discussion" group.
To unsubscribe from this group and stop receiving emails from it, send an email to repo-discuss+unsubscribe@googlegroups.com.
For more options, visit https://groups.google.com/d/optout.
Benoit "tsuna" Sigoure
Luca Milanesio
Oct 14, 2016, 7:53:04 PM10/14/16
to tsuna, Repo and Gerrit Discussion
Your average HTTP serving time is 0.5s, which is very high if you consider that it includes static resources as well.
Cannot see however the peaks up to 1 minute you were mentioning before.
Do you serve Git over HTTP as well?
--- * ---
That table shows you the actual HTTP requests and you can drill down into the associated SQL queries.
Luca.
On 15 Oct 2016, at 00:43, tsuna <tsun...@gmail.com> wrote:
Not sure which table you’re referring to, I only see a graph at that URL, and here it is:
<httpMeanTimes.png>
tsuna
Oct 14, 2016, 8:10:53 PM10/14/16
to Luca Milanesio, Repo and Gerrit Discussion
On Fri, Oct 14, 2016 at 4:52 PM, Luca Milanesio <luca.mi...@gmail.com> wrote:
Your average HTTP serving time is 0.5s, which is very high if you consider that it includes static resources as well.
The average is probably not a good metric to look at given the insane variance we see.
Cannot see however the peaks up to 1 minute you were mentioning before.Do you serve Git over HTTP as well?
Yes but virtually all accesses are over SSH.
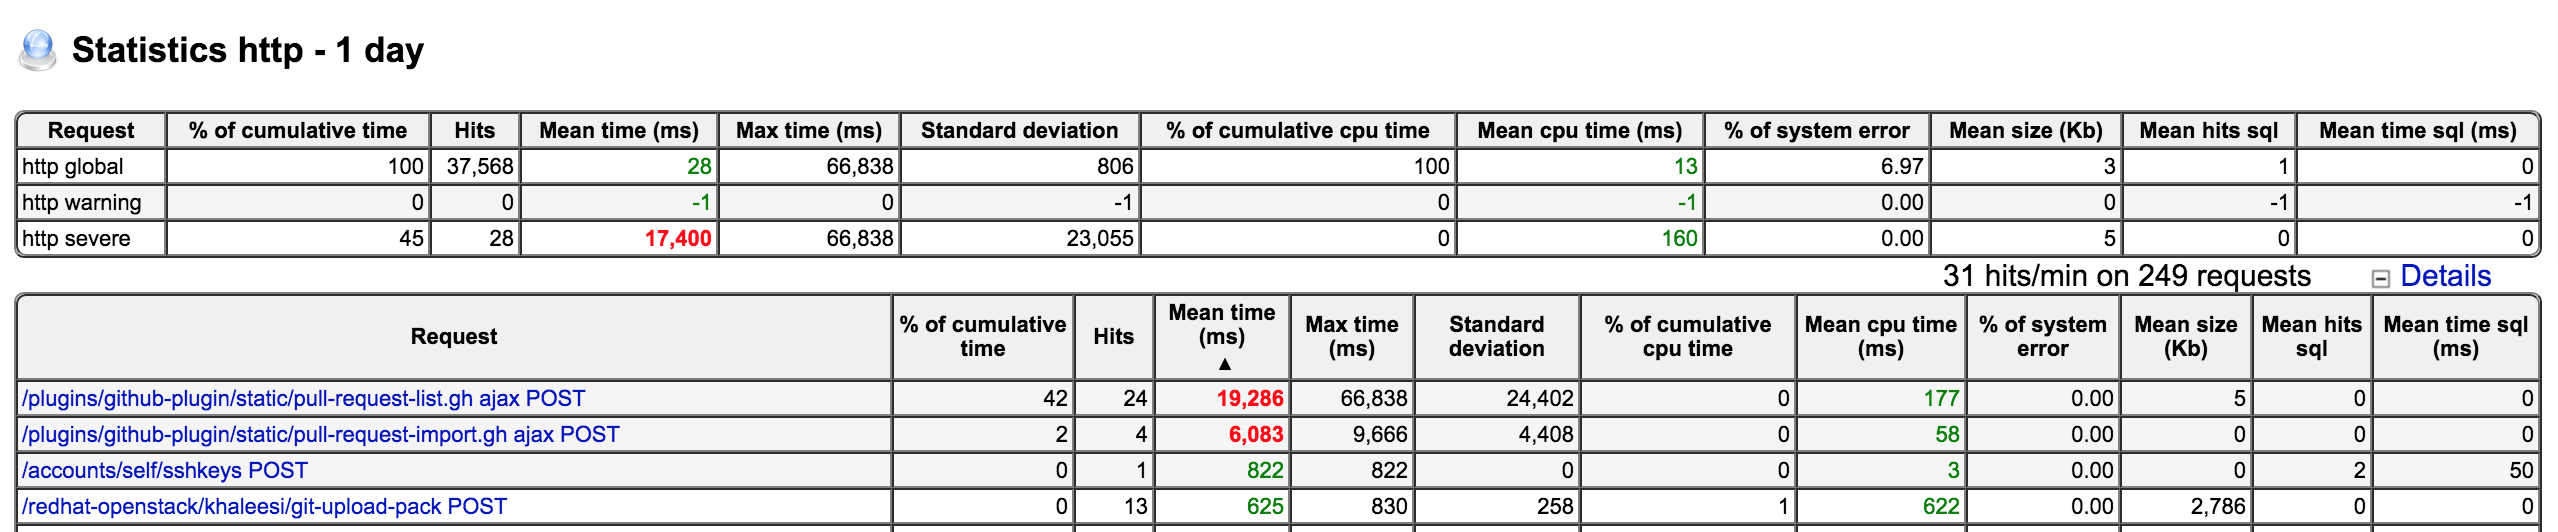
Here’s the table:
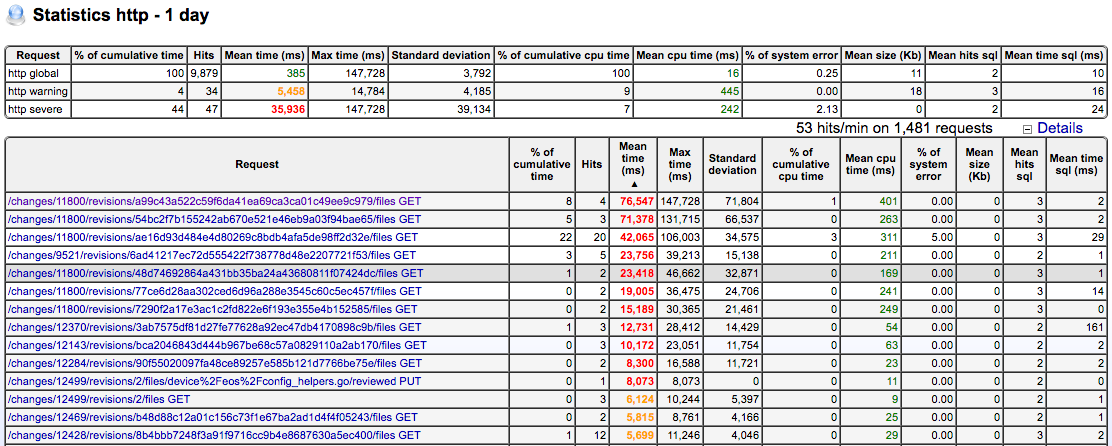
This information is too high level to root cause the problem. I haven’t started digging through the code yet, but I’m pretty I need to figure out what the hell is going on in the code serving /changes/<XXX>/revisions/<sha1-here>/files?reviewed. Again when loading a review most of the HTTP requests are responded to in typically less than 100ms, but this one takes forever.

Hence why I have a feeling that the slowness is mostly attributable to this particular API endpoint.
Benoit "tsuna" Sigoure
lucamilanesio
Oct 15, 2016, 5:00:02 PM10/15/16
to Repo and Gerrit Discussion, luca.mi...@gmail.com
The same URL has 76sec as mean value but with 71sec of variance????
What about if you inspect the Git object on the local filesystem? Does it take so long to retrieve its tree?
Luca.
tsuna
Oct 17, 2016, 3:02:24 AM10/17/16
to lucamilanesio, Repo and Gerrit Discussion
On Sat, Oct 15, 2016 at 2:00 PM, lucamilanesio <luca.mi...@gmail.com> wrote:
The same URL has 76sec as mean value but with 71sec of variance????
*shrug* for me hitting this URL has never returned a response in less than 30s. I’ve seen variances on the order of 45±15s approximately.
What about if you inspect the Git object on the local filesystem? Does it take so long to retrieve its tree?
No, it’s very fast from the filesystem, but I only tried doing “git show” on the sha1 in question, that’s probably not what Gerrit does.
I rebooted the box today and the problem still persists. I guess my next step is to rebuild Gerrit with some additional logging sprinkled throughout the code path executed by this API endpoint to try to zoom in on where time is being spent, unless anybody has a better suggestion to offer?
--
Benoit "tsuna" Sigoure

Björn Pedersen
Oct 17, 2016, 3:22:22 AM10/17/16
to Repo and Gerrit Discussion, luca.mi...@gmail.com
Hi,
I have an idea where you should look at: In 2.13 the reviewed flag has been migrated into it's own H2 database (unless yo uprovide a plugin to use another db) See https://gerrit-review.googlesource.com/#/c/78945/
My first guess would be that the H2 defaults for caching are not tuned well in your case, resulting in slow queries.See https://gerrit-review.googlesource.com/#/c/77824/ fot how this can be tuned now.
Björn
Luca Milanesio
Oct 17, 2016, 3:24:27 AM10/17/16
to tsuna, Repo and Gerrit Discussion
On 17 Oct 2016, at 08:01, tsuna <tsun...@gmail.com> wrote:On Sat, Oct 15, 2016 at 2:00 PM, lucamilanesio <luca.mi...@gmail.com> wrote:The same URL has 76sec as mean value but with 71sec of variance????*shrug* for me hitting this URL has never returned a response in less than 30s. I’ve seen variances on the order of 45±15s approximately.What about if you inspect the Git object on the local filesystem? Does it take so long to retrieve its tree?
No, it’s very fast from the filesystem, but I only tried doing “git show” on the sha1 in question, that’s probably not what Gerrit does.
You should try with JGit CLI in order to do something "similar" to Gerrit.
However the dig into the code should be around:
This should be the fragment for you:
private List<String> query(RevisionResource resource)
throws RepositoryNotFoundException, IOException {
Project.NameKey project = resource.getChange().getProject();
try (Repository git = gitManager.openRepository(project);
ObjectReader or = git.newObjectReader();
RevWalk rw = new RevWalk(or);
TreeWalk tw = new TreeWalk(or)) {
RevCommit c = rw.parseCommit(
ObjectId.fromString(resource.getPatchSet().getRevision().get()));
tw.addTree(c.getTree());
tw.setRecursive(true);
List<String> paths = new ArrayList<>();
while (tw.next() && paths.size() < 20) {
String s = tw.getPathString();
if (s.contains(query)) {
paths.add(s);
}
}
return paths;
}
}
Luca.
lucamilanesio
Oct 17, 2016, 3:30:27 AM10/17/16
to Repo and Gerrit Discussion, tsun...@gmail.com
Hi,
I did not notice the "reviewed" in the query string, then the relevant code is:
private Collection<String> reviewed(RevisionResource resource)
throws AuthException, OrmException {
CurrentUser user = self.get();
if (!(user.isIdentifiedUser())) {
throw new AuthException("Authentication required");
}
Account.Id userId = user.getAccountId();
Collection<String> r = accountPatchReviewStore.get()
.findReviewed(resource.getPatchSet().getId(), userId);
if (r.isEmpty() && 1 < resource.getPatchSet().getPatchSetId()) {
for (PatchSet ps : reversePatchSets(resource)) {
Collection<String> o =
accountPatchReviewStore.get().findReviewed(ps.getId(), userId);
if (!o.isEmpty()) {
try {
r = copy(Sets.newHashSet(o), ps.getId(), resource, userId);
} catch (IOException | PatchListNotAvailableException e) {
log.warn("Cannot copy patch review flags", e);
}
break;
}
}
}
return r;
}
Björn's suggestion is more appropriate then :-)
Luca.

Marcin Galazka
Mar 27, 2017, 9:45:59 AM3/27/17
to Repo and Gerrit Discussion, tsun...@gmail.com
Hi there.
After update from 2.11.x to 2.13.x we observed major slowdown in Gerrit UI. We pinpointed it to 'files?reviewed' requests which lead us to this discussion. The requests took often 7-10 seconds. Our Gerrit instance is pretty small (around 100 projects, probably no more than 20 commits per day per project on average). We tried to tune various H2-related settings but without results.
Any thoughts? As a workaround we put 'reviewed flag' H2 database into ram-disk. This way the flags are lost after each restart, but due to the rather temporary nature of this data it is not such a big problem. Anyway it would be great to get it solved. ('files?reviewed? requests are still by far the slowest but usually they take no more than 300-500ms).

Saša Živkov
Mar 27, 2017, 10:29:20 AM3/27/17
to Marcin Galazka, Repo and Gerrit Discussion, tsun...@gmail.com
On Mon, Mar 27, 2017 at 3:31 PM, Marcin Galazka <marcin.r...@gmail.com> wrote:
Hi there.After update from 2.11.x to 2.13.x we observed major slowdown in Gerrit UI. We pinpointed it to 'files?reviewed' requests which lead us to this discussion. The requests took often 7-10 seconds. Our Gerrit instance is pretty small (around 100 projects, probably no more than 20 commits per day per project on average). We tried to tune various H2-related settings but without results.Any thoughts?
Just to be absolutely sure that the issue is related to the H2 database, create 2-3 thread dumps during these 7-10 seconds while waiting on a response.
Use the following command for creating 3 thread dumps with 2 seconds distance:
$ cd $GERRIT_SITE/logs
$ jstack $(cat gerrit.pid) >td1 && sleep 2 && jstack $(cat gerrit.pid) >td2 && sleep 2 && jstack $(cat gerrit.pid) >td3
Then look inside the td1, td2 and td3 files. It should be easy to find the thread which was processing the files?reviewed request.
Compare the stack traces for that thread in td1/2/3 and see what it was waiting on and if it was always waiting on the same thing (H2)?
Alternatively, post the stack traces here.

fdoe...@googlemail.com
Mar 29, 2017, 4:46:17 AM3/29/17
to Repo and Gerrit Discussion
Hi,
I experience the same issue. Compared to everything described here, our gerrit instance is tiny. However we also have loading times of files?reviewed between 1 and 7 seconds. As the source code already indicates, the response time rises with the number of patchsets. (7 seconds for 11 patchsets and <2 seconds for 2-3 patchsets.) To help to debug this issue further I executed jstack while waiting for a response. As far as I see, I get two different places where time is needed. Here is the relevant part of the first stacktrace:
at java.io.FileDescriptor.sync(Native Method)
at org.h2.store.fs.FileDisk.force(FilePathDisk.java:410)
at org.h2.store.FileStore.sync(FileStore.java:419)
at org.h2.store.PageStore.writeVariableHeader(PageStore.java:982)
at org.h2.store.PageStore.setLogFirstPage(PageStore.java:976)
at org.h2.store.PageLog.openForWriting(PageLog.java:190)
at org.h2.store.PageStore.openForWriting(PageStore.java:387)
at org.h2.store.PageStore.openExisting(PageStore.java:373)
at org.h2.store.PageStore.open(PageStore.java:289)
- locked <0x000000075f1efa08> (a org.h2.store.PageStore)
at org.h2.engine.Database.getPageStore(Database.java:2366)
at org.h2.engine.Database.open(Database.java:657)
- locked <0x000000075f1e2820> (a org.h2.engine.Database)
at org.h2.engine.Database.openDatabase(Database.java:260)
at org.h2.engine.Database.<init>(Database.java:254)
at org.h2.engine.Engine.openSession(Engine.java:57)
at org.h2.engine.Engine.openSession(Engine.java:164)
- locked <0x0000000609a4d738> (a org.h2.engine.Engine)
at org.h2.engine.Engine.createSessionAndValidate(Engine.java:142)
at org.h2.engine.Engine.createSession(Engine.java:125)
at org.h2.engine.Engine.createSession(Engine.java:27)
at org.h2.engine.SessionRemote.connectEmbeddedOrServer(SessionRemote.java:331)
at org.h2.jdbc.JdbcConnection.<init>(JdbcConnection.java:107)
at org.h2.jdbc.JdbcConnection.<init>(JdbcConnection.java:91)
at org.h2.Driver.connect(Driver.java:74)
at java.sql.DriverManager.getConnection(DriverManager.java:571)
at java.sql.DriverManager.getConnection(DriverManager.java:233)
at com.google.gerrit.server.schema.H2AccountPatchReviewStore.findReviewed(H2AccountPatchReviewStore.java:222)
at com.google.gerrit.server.change.Files$ListFiles.reviewed(Files.java:236)
The second stacktrace shows this:
at java.io.FileDescriptor.sync(Native Method)
at org.h2.store.fs.FileDisk.force(FilePathDisk.java:410)
at org.h2.store.FileStore.sync(FileStore.java:419)
at org.h2.store.PageStore.writeVariableHeader(PageStore.java:982)
at org.h2.store.PageStore.setLogFirstPage(PageStore.java:976)
at org.h2.store.PageLog.removeUntil(PageLog.java:726)
at org.h2.store.PageStore.checkpoint(PageStore.java:441)
- locked <0x000000075ec5a8e0> (a org.h2.store.PageStore)
at org.h2.store.PageStore.compact(PageStore.java:615)
- locked <0x000000075ec5a8e0> (a org.h2.store.PageStore)
at org.h2.engine.Database.closeOpenFilesAndUnlock(Database.java:1301)
- locked <0x000000075ec4d4d0> (a org.h2.engine.Database)
at org.h2.engine.Database.close(Database.java:1251)
- locked <0x000000075ec4d4d0> (a org.h2.engine.Database)
at org.h2.engine.Database.removeSession(Database.java:1122)
- locked <0x000000075ec4d4d0> (a org.h2.engine.Database)
at org.h2.engine.Session.close(Session.java:672)
at org.h2.jdbc.JdbcConnection.close(JdbcConnection.java:383)
- locked <0x000000075ed50c60> (a org.h2.engine.Session)
- locked <0x000000075ec4c4a0> (a org.h2.jdbc.JdbcConnection)
at com.google.gerrit.server.schema.H2AccountPatchReviewStore.findReviewed(H2AccountPatchReviewStore.java:236)
at com.google.gerrit.server.change.Files$ListFiles.reviewed(Files.java:236)
So it seems one H2-request (consisting of open connection, execute query and close connection) takes approx. 500ms on our installation.
More info at http://groups.google.com/group/repo-discuss?hl=en
---
You received this message because you are subscribed to the Google Groups "Repo and Gerrit Discussion" group.
To unsubscribe from this group and stop receiving emails from it, send an email to repo-discuss...@googlegroups.com.

David Ostrovsky
Mar 30, 2017, 7:38:11 AM3/30/17
to Repo and Gerrit Discussion
Am Mittwoch, 29. März 2017 10:46:17 UTC+2 schrieb fdoe...@googlemail.com:
Hi,
I experience the same issue. Compared to everything described here, our gerrit instance is tiny. However we also have loading times of files?reviewed between 1 and 7 seconds. As the source code already indicates, the response time rises with the number of patchsets. (7 seconds for 11 patchsets and <2 seconds for 2-3 patchsets.)
What code are you referring to? I'm not aware that we load reviewed file bits for all
patch sets on opening change screen. I've just opened that change: [1] with
max(patch set number) = 76: 1-2 seconds load time, and that's fine.
fdoe...@googlemail.com
Mar 30, 2017, 12:10:29 PM3/30/17
to Repo and Gerrit Discussion
Sorry, I only looked over the code superficially. I am referring to [1]. As I see it: The code loads reviewed-flags for the a given patchset. If there are reviewed-flags set, the code ends. But if no reviewed-flags are found it iterates down to the first patchset. The code in L230 always opens and closes a H2-Connection, this seems to be fairly slow (500ms) on our installation. So the issue should only occur if there are no reviewed-flags in a (recent) patchset. (And as I don't use reviewed-flags often i run into this issue).
So what I tested on a change with 11 patchsets on our gerrit instance (without any reviewed-flags by me):
open patchset 11: 6670 ms
Set a reviewed-flag in patchset 11 (on a file that is the same in patchset 10 and 11 but different in 9)
Open patchset 11: 670ms
Open patchset 10: 700ms
Open patchset 9 [file i checked is different here]: 1100ms
Remove the reviewed-flag. (Interestingly this only works if I remove it from patchset 10 but not if I remote it from patchset 11)
Open patchset 11: 5800ms
Open patchset 10: 5700ms
Open patchset 2: 5700ms
Open patchset 1: 600ms
(timings are the response time of files?reviewed)
I wasn't able do reproduce any slow response on the change that you provided.
[1] https://gerrit.googlesource.com/gerrit/+/master/gerrit-server/src/main/java/com/google/gerrit/server/change/Files.java#225
David Ostrovsky
Mar 30, 2017, 5:36:40 PM3/30/17
to Repo and Gerrit Discussion
On Thursday, March 30, 2017 at 6:10:29 PM UTC+2, fdoe...@googlemail.com wrote:
Am Donnerstag, 30. März 2017 13:38:11 UTC+2 schrieb David Ostrovsky:
Am Mittwoch, 29. März 2017 10:46:17 UTC+2 schrieb fdoe...@googlemail.com:Hi,
I experience the same issue. Compared to everything described here, our gerrit instance is tiny. However we also have loading times of files?reviewed between 1 and 7 seconds. As the source code already indicates, the response time rises with the number of patchsets. (7 seconds for 11 patchsets and <2 seconds for 2-3 patchsets.)What code are you referring to? I'm not aware that we load reviewed file bits for allpatch sets on opening change screen. I've just opened that change: [1] withmax(patch set number) = 76: 1-2 seconds load time, and that's fine.
Sorry, I only looked over the code superficially. I am referring to [1]. As I see it: The code loads reo viewed-flags for the a given patchset. If there are reviewed-flags set, the code ends. But if no reviewed-flags are found it iterates down to the first patchset. The code in L230 always opens and closes a H2-Connection, this seems to be fairly slow (500ms) on our installation. So the issue should only occur if there are no reviewed-flags in a (recent) patchset. (And as I don't use reviewed-flags often i run into this issue).
You are right. I'm able to reproduce the issue. I created 20 patch sets, with no
reviewed bit set in all of them, and see that 20 selects are fired and also
see severe performance degradation: on my laptop this single REST call
takes now 1 second.
Two problems with this code:
1. We are firing n selects for n patch set in the worst case. This sounds
wrong to me.
2. DriverManager.getConnection(url) is used to access the database.
This is wrong. When the only H2 connection is closed, the database
is shut down. If the application closes the only connection after each
operation, the database is opened and closed a lot, which is quite slow.
Instead, connection pooling must be used. For my example above, this
reduced the time for 20 selects from 1 second to 20 ms: factor 50.
David Ostrovsky
Mar 30, 2017, 6:32:45 PM3/30/17
to Repo and Gerrit Discussion
On Thursday, March 30, 2017 at 11:36:40 PM UTC+2, David Ostrovsky wrote:
On Thursday, March 30, 2017 at 6:10:29 PM UTC+2, fdoe...@googlemail.com wrote:
Am Donnerstag, 30. März 2017 13:38:11 UTC+2 schrieb David Ostrovsky:
Am Mittwoch, 29. März 2017 10:46:17 UTC+2 schrieb fdoe...@googlemail.com:Hi,
I experience the same issue. Compared to everything described here, our gerrit instance is tiny. However we also have loading times of files?reviewed between 1 and 7 seconds. As the source code already indicates, the response time rises with the number of patchsets. (7 seconds for 11 patchsets and <2 seconds for 2-3 patchsets.)What code are you referring to? I'm not aware that we load reviewed file bits for allpatch sets on opening change screen. I've just opened that change: [1] withmax(patch set number) = 76: 1-2 seconds load time, and that's fine.
Sorry, I only looked over the code superficially. I am referring to [1]. As I see it: The code loads reo viewed-flags for the a given patchset. If there are reviewed-flags set, the code ends. But if no reviewed-flags are found it iterates down to the first patchset. The code in L230 always opens and closes a H2-Connection, this seems to be fairly slow (500ms) on our installation. So the issue should only occur if there are no reviewed-flags in a (recent) patchset. (And as I don't use reviewed-flags often i run into this issue).You are right. I'm able to reproduce the issue.
I filed this issue and working on a fix: [1].
David Ostrovsky
Mar 31, 2017, 2:10:33 AM3/31/17
to Repo and Gerrit Discussion
On Thursday, March 30, 2017 at 11:36:40 PM UTC+2, David Ostrovsky wrote:
On Thursday, March 30, 2017 at 6:10:29 PM UTC+2, fdoe...@googlemail.com wrote:
Am Donnerstag, 30. März 2017 13:38:11 UTC+2 schrieb David Ostrovsky:
Am Mittwoch, 29. März 2017 10:46:17 UTC+2 schrieb fdoe...@googlemail.com:Hi,
I experience the same issue. Compared to everything described here, our gerrit instance is tiny. However we also have loading times of files?reviewed between 1 and 7 seconds. As the source code already indicates, the response time rises with the number of patchsets. (7 seconds for 11 patchsets and <2 seconds for 2-3 patchsets.)What code are you referring to? I'm not aware that we load reviewed file bits for allpatch sets on opening change screen. I've just opened that change: [1] withmax(patch set number) = 76: 1-2 seconds load time, and that's fine.
Sorry, I only looked over the code superficially. I am referring to [1]. As I see it: The code loads reo viewed-flags for the a given patchset. If there are reviewed-flags set, the code ends. But if no reviewed-flags are found it iterates down to the first patchset. The code in L230 always opens and closes a H2-Connection, this seems to be fairly slow (500ms) on our installation. So the issue should only occur if there are no reviewed-flags in a (recent) patchset. (And as I don't use reviewed-flags often i run into this issue).You are right. I'm able to reproduce the issue. I created 20 patch sets, with noreviewed bit set in all of them, and see that 20 selects are fired and alsosee severe performance degradation: on my laptop this single REST calltakes now 1 second.Two problems with this code:1. We are firing n selects for n patch set in the worst case. This soundswrong to me.

Sachin S
Nov 3, 2019, 2:39:10 PM11/3/19
to Repo and Gerrit Discussion
I am using Gerrit version (12.14.9) and I am also facing the same kind of issue and the more details was shared below, Har file image also shared.
Taking huge time in response (nearly150 secs) for API endpoint “GET files?reviewed”.
Thread dumbs
---------------------
"H2 Log Writer DIFF_INTRALINE" daemon prio=5 BLOCKED
org.h2.engine.Database.flush(Database.java:1958)
org.h2.store.WriterThread.run(WriterThread.java:87)
java.lang.Thread.run(Thread.java:748)
H2 File Lock Watchdog /gerrit/gerrit/cache/web_sessions.lock.db" daemon prio=9 TIMED_WAITING
java.lang.Thread.sleep(Native Method)
org.h2.store.FileLock.run(FileLock.java:517)
java.lang.Thread.run(Thread.java:748)
Is this issue fixed in 2.15.x versions ?
Regards,
Sachin S

Matthias Sohn
Nov 3, 2019, 4:27:42 PM11/3/19
to Sachin S, Repo and Gerrit Discussion
this doesn't look like a complete Gerrit thread dump. Create several thread dumps with a few seconds distance
and compare them to see which thread doesn't move.
Is this issue fixed in 2.15.x versions ?
the bug fix for https://bugs.chromium.org/p/gerrit/issues/detail?id=5907 is included since 2.13.8
I'd recommend to update to 2.16 since EOL for 2.15 is planned for November
-Matthias
Reply all
Reply to author
Forward
0 new messages