small key cost long running time
40 views
Skip to first unread message

Romber Li
Apr 25, 2018, 2:02:59 AM4/25/18
to redi...@googlegroups.com
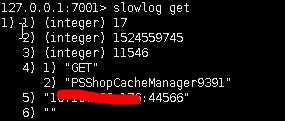
a small key less than 4KB and a simple get command costs over 10ms in unknown
circumstances,
i've also seen over 1.6s on other redis servers(see detail at https://github.com/antirez/redis/issues/4851).
this server is a different server, with 8 cores and 32GB RAM,running 2 instances(a master and a slave), each instance could use up to 12GB RAM.
it's a redis cluster with 4 same type of servers, each of them is running 2 instances.
the version is redis 4.0.8,
i've also uploaded some screenshot and nmon monitoring data(it contains cpu usage per core),
please help me on this problem,
thanks in advance.


hva...@gmail.com
Apr 25, 2018, 10:29:26 AM4/25/18
to Redis DB
There are a number of potential causes. Based on my past experience, the very first one to consider is whether the client had lost its connection to the Redis server and needed to re-connect before sending the GET command and receiving the key's contents. Nearly all the high-level language clients for databases hide disconnects and re-connects from the application that's using the client, so a disconnect/re-connect appears to be unexplained slowness.
Romber Li
Apr 25, 2018, 10:40:18 PM4/25/18
to redi...@googlegroups.com, redi...@googlegroups.com
hi,
thanks for your kindly reply.as far as I know, time spents recorded in slowlog is just execution time that main thread of redis server processed the command,
time of sending and receiving data is not included in slowlog time spents.
so I don't get how it concerned with network problem.
--
You received this message because you are subscribed to the Google Groups "Redis DB" group.
To unsubscribe from this group and stop receiving emails from it, send an email to redis-db+unsubscribe@googlegroups.com.
To post to this group, send email to redi...@googlegroups.com.
Visit this group at https://groups.google.com/group/redis-db.
For more options, visit https://groups.google.com/d/optout.
Romber Li
Apr 26, 2018, 11:31:26 PM4/26/18
to redi...@googlegroups.com
hi,
thanks for your kindly reply.as far as I know, time spents recorded in slowlog is just execution time that main thread of redis server processed the command,
time of sending and receiving data is not included in slowlog time spents.
so I don't get how it concerned with network problem.
2018-04-25 22:29 GMT+08:00 <hva...@gmail.com>:
hva...@gmail.com
Apr 27, 2018, 11:31:30 AM4/27/18
to Redis DB
What else is happening with that Redis server process or on the server at the times the slowlog shows slow key accesses? Is the process performing a snapshot save to disk? Do you server monitoring graphs show large changes in resource consumption, like cpu, or memory, or swap, or other things?
On Wednesday, April 25, 2018 at 7:40:18 PM UTC-7, Romber Li wrote:
hi,thanks for your kindly reply.as far as I know, time spents recorded in slowlog is just execution time that main thread of redis server processed the command,time of sending and receiving data is not included in slowlog time spents.so I don't get how it concerned with network problem.
2018-04-25 22:29 GMT+08:00 <hva...@gmail.com>:
There are a number of potential causes. Based on my past experience, the very first one to consider is whether the client had lost its connection to the Redis server and needed to re-connect before sending the GET command and receiving the key's contents. Nearly all the high-level language clients for databases hide disconnects and re-connects from the application that's using the client, so a disconnect/re-connect appears to be unexplained slowness.
On Tuesday, April 24, 2018 at 11:02:59 PM UTC-7, Romber Li wrote:a small key less than 4KB and a simple get command costs over 10ms in unknown circumstances,i've also seen over 1.6s on other redis servers(see detail at https://github.com/antirez/redis/issues/4851).this server is a different server, with 8 cores and 32GB RAM,running 2 instances(a master and a slave), each instance could use up to 12GB RAM.it's a redis cluster with 4 same type of servers, each of them is running 2 instances.the version is redis 4.0.8,i've also uploaded some screenshot and nmon monitoring data(it contains cpu usage per core),please help me on this problem,thanks in advance.


--
You received this message because you are subscribed to the Google Groups "Redis DB" group.
To unsubscribe from this group and stop receiving emails from it, send an email to redis-db+u...@googlegroups.com.
Romber Li
Apr 30, 2018, 9:11:38 AM4/30/18
to redi...@googlegroups.com
as it's a dedicated redis server, and we don't enable persistence,
so i think there is only application requests and a few monitoring requests.
i've uploaded nmon data, please kindly check the attach file.
To unsubscribe from this group and stop receiving emails from it, send an email to redis-db+unsubscribe@googlegroups.com.
Romber Li
May 3, 2018, 2:08:14 AM5/3/18
to redi...@googlegroups.com
hi, is there any news?
it bothered several days,
someone help me please...
2018-04-27 23:31 GMT+08:00 <hva...@gmail.com>:
To unsubscribe from this group and stop receiving emails from it, send an email to redis-db+unsubscribe@googlegroups.com.
hva...@gmail.com
May 4, 2018, 11:18:27 AM5/4/18
to Redis DB
I'm sorry, I'm a Linux user, and while rmon is a Linux monitoring program, it's one that is not familiar to me. The output, packed into a Windows spreadsheet file, is not something I can view on my Linux laptop. I tried to import the file into Google's spreadsheet utility, but I got an error saying the file was too large. Besides that, the rmon data isn't useful without the corresponding Redis slowlog to compare against.
My question asking about comparisons between the slowlog and monitoring data were meant to guide your investigation of the trouble you're seeing. I'm not a Redis Labs employee or connected with Redis in any other formal way. I'm a Redis user who offers what assistance I can in answering questions on this mailing list. Examining detailed server monitor data isn't the kind of thing I can do, though I tried to look at the file you included.
In my previous post, I asked about graphs of the server monitoring data. Is your rmon data converted into graphs that you can view for the cpu consumption, memory consumption, network i/o, and disk i/o, before you resort to scanning the raw data?
Reply all
Reply to author
Forward
0 new messages