RAxML-EPA output files
309 views
Skip to first unread message

Frédéric Delsuc
May 12, 2016, 10:42:49 AM5/12/16
to raxml
Hi,
Could someone please tell me what exactly are the values reported in the last two columns of the "RAxML_classification" file resulting from an RAxML-EPA analysis?
Example:
ZOO-064b_M13F I29 1 0.00178454802854413749
ZOO-065a_M13-F I29 1 0.00168648656206445645
ZOO-066a_M13-F I29 1 0.00712137782479591291
13297Y14_M13-R I139 1 0.00000100000050002909
Thanks!
Fred

Alexandros Stamatakis
May 13, 2016, 4:47:47 AM5/13/16
to ra...@googlegroups.com
Dear Fred,
The third column is just the number of times that read was inserted into
that branch (this should be always one, it's a left-over from the
bootstrapping procedure that was later removed again),.
The 4th column is the so-called pendant branch length, that is, the
branch length leading to the placed read/query sequence.
I would recommend that you rather use the standardized .jplace output
format that is also generated by RAxML-EPA:
http://journals.plos.org/plosone/article?id=10.1371/journal.pone.0031009
it can be visualized with:
http://itol3.embl.de/
and post-analyzed with:
http://genesis-lib.org/
alexis
> --
> You received this message because you are subscribed to the Google
> Groups "raxml" group.
> To unsubscribe from this group and stop receiving emails from it, send
> an email to raxml+un...@googlegroups.com
> <mailto:raxml+un...@googlegroups.com>.
> For more options, visit https://groups.google.com/d/optout.
--
Alexandros (Alexis) Stamatakis
Research Group Leader, Heidelberg Institute for Theoretical Studies
Full Professor, Dept. of Informatics, Karlsruhe Institute of Technology
Adjunct Professor, Dept. of Ecology and Evolutionary Biology, University
of Arizona at Tucson
www.exelixis-lab.org
The third column is just the number of times that read was inserted into
that branch (this should be always one, it's a left-over from the
bootstrapping procedure that was later removed again),.
The 4th column is the so-called pendant branch length, that is, the
branch length leading to the placed read/query sequence.
I would recommend that you rather use the standardized .jplace output
format that is also generated by RAxML-EPA:
http://journals.plos.org/plosone/article?id=10.1371/journal.pone.0031009
it can be visualized with:
http://itol3.embl.de/
and post-analyzed with:
http://genesis-lib.org/
alexis
> You received this message because you are subscribed to the Google
> Groups "raxml" group.
> To unsubscribe from this group and stop receiving emails from it, send
> an email to raxml+un...@googlegroups.com
> <mailto:raxml+un...@googlegroups.com>.
> For more options, visit https://groups.google.com/d/optout.
--
Alexandros (Alexis) Stamatakis
Research Group Leader, Heidelberg Institute for Theoretical Studies
Full Professor, Dept. of Informatics, Karlsruhe Institute of Technology
Adjunct Professor, Dept. of Ecology and Evolutionary Biology, University
of Arizona at Tucson
www.exelixis-lab.org
Frédéric Delsuc
May 13, 2016, 5:10:28 AM5/13/16
to raxml
Hi Alexis,
Thanks for your answer.
We are also using the standardized jplace file and its display in iTol and post analysis by Genesis but I was kind of puzzled by the fact that in this particular file the 3rd column was always 1.
Best wishes,
Fred
Alexandros Stamatakis
May 13, 2016, 5:12:15 AM5/13/16
to ra...@googlegroups.com
:-)
alexis
> > an email to raxml+un...@googlegroups.com <javascript:>
> > <mailto:raxml+un...@googlegroups.com <javascript:>>.
alexis
> > <mailto:raxml+un...@googlegroups.com <javascript:>>.
> > For more options, visit https://groups.google.com/d/optout
> <https://groups.google.com/d/optout>.
>
> --
> Alexandros (Alexis) Stamatakis
>
> Research Group Leader, Heidelberg Institute for Theoretical Studies
> Full Professor, Dept. of Informatics, Karlsruhe Institute of Technology
> Adjunct Professor, Dept. of Ecology and Evolutionary Biology,
> University
> of Arizona at Tucson
>
> www.exelixis-lab.org <http://www.exelixis-lab.org>
> --
> Alexandros (Alexis) Stamatakis
>
> Research Group Leader, Heidelberg Institute for Theoretical Studies
> Full Professor, Dept. of Informatics, Karlsruhe Institute of Technology
> Adjunct Professor, Dept. of Ecology and Evolutionary Biology,
> University
> of Arizona at Tucson
>

lucas...@h-its.org
May 13, 2016, 5:31:34 AM5/13/16
to raxml
Hi Frédéric,
thanks for using Genesis! Let me know if you have any questions.
What kind of post-analysis are you doing, and is there any feature missing in Genesis that you'd need? I'm always looking for inspiration ;-)
Lucas
thanks for using Genesis! Let me know if you have any questions.
What kind of post-analysis are you doing, and is there any feature missing in Genesis that you'd need? I'm always looking for inspiration ;-)
Lucas
Frédéric Delsuc
May 13, 2016, 9:15:18 AM5/13/16
to raxml
Hi Lucas,
So far we are using the Genesis library to display jplace trees summarizing evolutionary placements on a reference tree with colored branches.
And it's working well :) Thanks!
What would be great would be to produce an iTOL-like visualization with circles, but I guess that you are dependent on FigTree that does not allow such a display.
Fred
lucas...@h-its.org
May 19, 2016, 8:54:47 AM5/19/16
to raxml
Hi Fred,
sorry for the late answer. For the visualisation with coloured branches, I used FigTree simply because it was easy to write out files in their format. It is however not a big issue to add more output file formats.
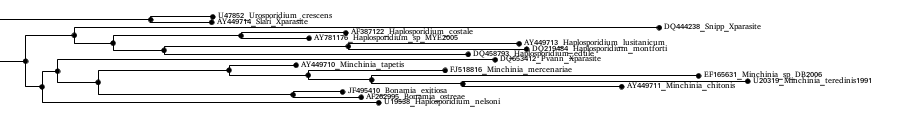
I looked at the annotation capabilities of FigTree - it only supports shapes at nodes, not at edges (see attachment). Same for Dendroscope. So, if you want to summarize the placement mass per branch as the size of a circle (for example), this works: As the reference tree can be drawn rooted, you can interpret the shape at the node as belonging to the edge towards the root. For your own visual inspection, this should suffice, but for a publication figure, you'd probably want the shape to sit at the branch instead.
Also, if you don't want to summarize the data, but instead visualize each placement position as a shape, this does not work. So, if you know of a tree viewer that supports adding shapes along the branches, let me know. It should be possible to write some file format for such a viewer.
Lucas
sorry for the late answer. For the visualisation with coloured branches, I used FigTree simply because it was easy to write out files in their format. It is however not a big issue to add more output file formats.
I looked at the annotation capabilities of FigTree - it only supports shapes at nodes, not at edges (see attachment). Same for Dendroscope. So, if you want to summarize the placement mass per branch as the size of a circle (for example), this works: As the reference tree can be drawn rooted, you can interpret the shape at the node as belonging to the edge towards the root. For your own visual inspection, this should suffice, but for a publication figure, you'd probably want the shape to sit at the branch instead.
Also, if you don't want to summarize the data, but instead visualize each placement position as a shape, this does not work. So, if you know of a tree viewer that supports adding shapes along the branches, let me know. It should be possible to write some file format for such a viewer.
Lucas
Reply all
Reply to author
Forward
0 new messages