general question
32 views
Skip to first unread message

mehrosadate...@gmail.com
Nov 12, 2016, 1:39:00 PM11/12/16
to QuTiP: Quantum Toolbox in Python
Hello.
I have a general question about codes in qutip.
what is the exactly role of second number in line 5 in my code ( I mean 1000 in taus=np.linspace(0,1000,8000) )?
my code is in this way:
from qutip import *
import matplotlib.pyplot as plt
import numpy as np
N=25
taus=np.linspace(0,1000,8000)
a=tensor(identity(2),destroy(N))
sz=tensor(sigmaz(),identity(N))
sm=tensor(sigmam(),identity(N))
g=2*np.pi*33.9*0.001
H=g*a.dag()*a+g*0.5*sz+g*(sm.dag()*a+sm*a.dag())+(5.76*0.001)*(a+a.dag())
c_ops=[np.sqrt(2*np.pi*4.1*0.001)*a,np.sqrt(2*np.pi*2.6*0.001)*sm]
corr=coherence_function_g2(H,taus,c_ops,a)
plt.plot(np.real(corr),lw=1.5,ls='-')
plt.xlabel(r'$\tau(ns)$',fontsize=20,fontweight='bold')
plt.ylabel(r'$g^{(2)}(\tau)$',fontsize=20,fontweight='bold')
plt.show()
Regards
Mehrosadat

Andrew Dawes
Nov 12, 2016, 5:17:19 PM11/12/16
to qu...@googlegroups.com
The parameters are start,stop,num where num is number of points
Sent from my phone using voice-recognition software and/or clumsy thumbs, please forgive any typos.
--
You received this message because you are subscribed to the Google Groups "QuTiP: Quantum Toolbox in Python" group.
To unsubscribe from this group and stop receiving emails from it, send an email to qutip+un...@googlegroups.com.
For more options, visit https://groups.google.com/d/optout.
mehrosadate...@gmail.com
Nov 12, 2016, 10:05:16 PM11/12/16
to QuTiP: Quantum Toolbox in Python
Dear Dr.Dawes,
I am really confused !
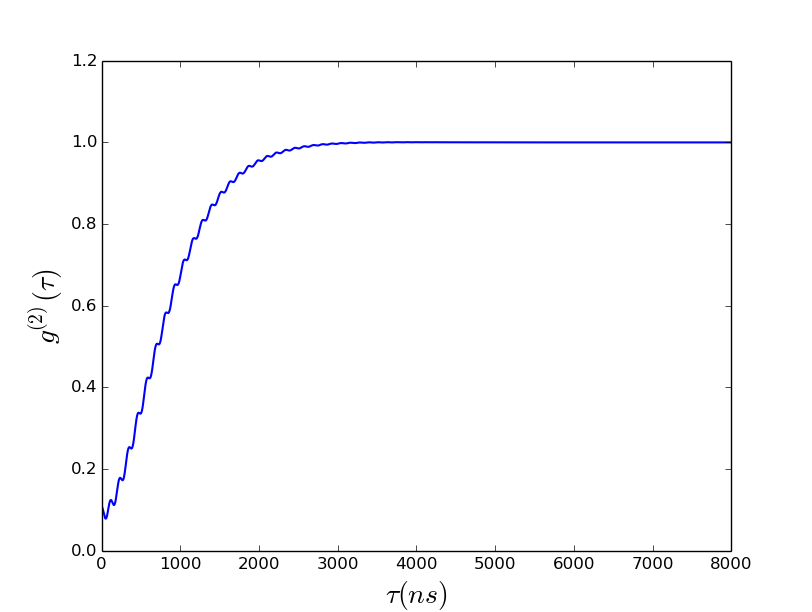
Because the result of my code shows another things. As you can see from attached figure, It shows that the parameters are start, num and stop !!!
what is the correct answer?
Regards
Mehrosadat
I am really confused !
Because the result of my code shows another things. As you can see from attached figure, It shows that the parameters are start, num and stop !!!
what is the correct answer?
Regards
Mehrosadat

Paul Nation
Nov 12, 2016, 10:34:02 PM11/12/16
to QuTiP Group
You are plotting only the y values..
To unsubscribe from this group and stop receiving emails from it, send an email to qutip+unsubscribe@googlegroups.com.
Andrew Dawes
Nov 13, 2016, 10:08:49 AM11/13/16
to qu...@googlegroups.com
This overview of the plotting commands may be useful. It covers many of the questions you have asked about plots and settings:
Specifically, as Paul said, you aren't actually plotting g(2) vs t, you are plotting g(2) only so the values go from 0,8000 because there are 8000 of them in the array. You want to put your time array in the plot function too.
Sent from my phone using voice-recognition software and/or clumsy thumbs, please forgive any typos.
mehrosadate...@gmail.com
Nov 14, 2016, 11:55:07 AM11/14/16
to QuTiP: Quantum Toolbox in Python
1) Do mean that 1000 is unnecessary , and putting taus=np.linspace(0,8000) is enough ?
If we do that, we will receive another result !!!
2) How can we be sure that the selected number of points (num) is true?
Regards
Mehrosadat
Paul Nation
Nov 14, 2016, 12:58:12 PM11/14/16
to QuTiP Group
You need all three. 0 is the start number, 1000 is the end, and 8000 is how many steps you take from start to end.
To unsubscribe from this group and stop receiving emails from it, send an email to qutip+unsubscribe@googlegroups.com.
Andrew Dawes
Nov 14, 2016, 3:29:19 PM11/14/16
to qu...@googlegroups.com
No, the change needs to be in the plot command. Make it:
plt.plot(taus,np.real(corr),lw=1.5,ls='-')
That way 'taus' is your x value (time) and 'np.real(corr)' is the y value. If you only put one array in the plot function it plots the values against the position within the array. If you want a graph of y vs t then you have to give the t array and the y array (and they have to be the same length). Please look through the plotting tutorial, it answers all of these questions quite clearly.
Sent from my phone using voice-recognition software and/or clumsy thumbs, please forgive any typos.
plt.plot(np.real(corr),lw=1.5,ls='-'
Reply all
Reply to author
Forward
0 new messages