asyncio lost udp packets
258 views
Skip to first unread message

vpavesi
Jun 9, 2016, 9:50:27 AM6/9/16
to python-tulip
hello,
I did open this issue
and I got recommendation from to open a discussion .
I do have a solution by UDP.
+++++
client generating traffic by SCTP -----> server generating reports by UDP ( without any response back) --->
server asyncio receiving UDP and sending heartbeat every 10 seconds to another ip.addr and sending all reports by tcp to elasticsearch.
+++++
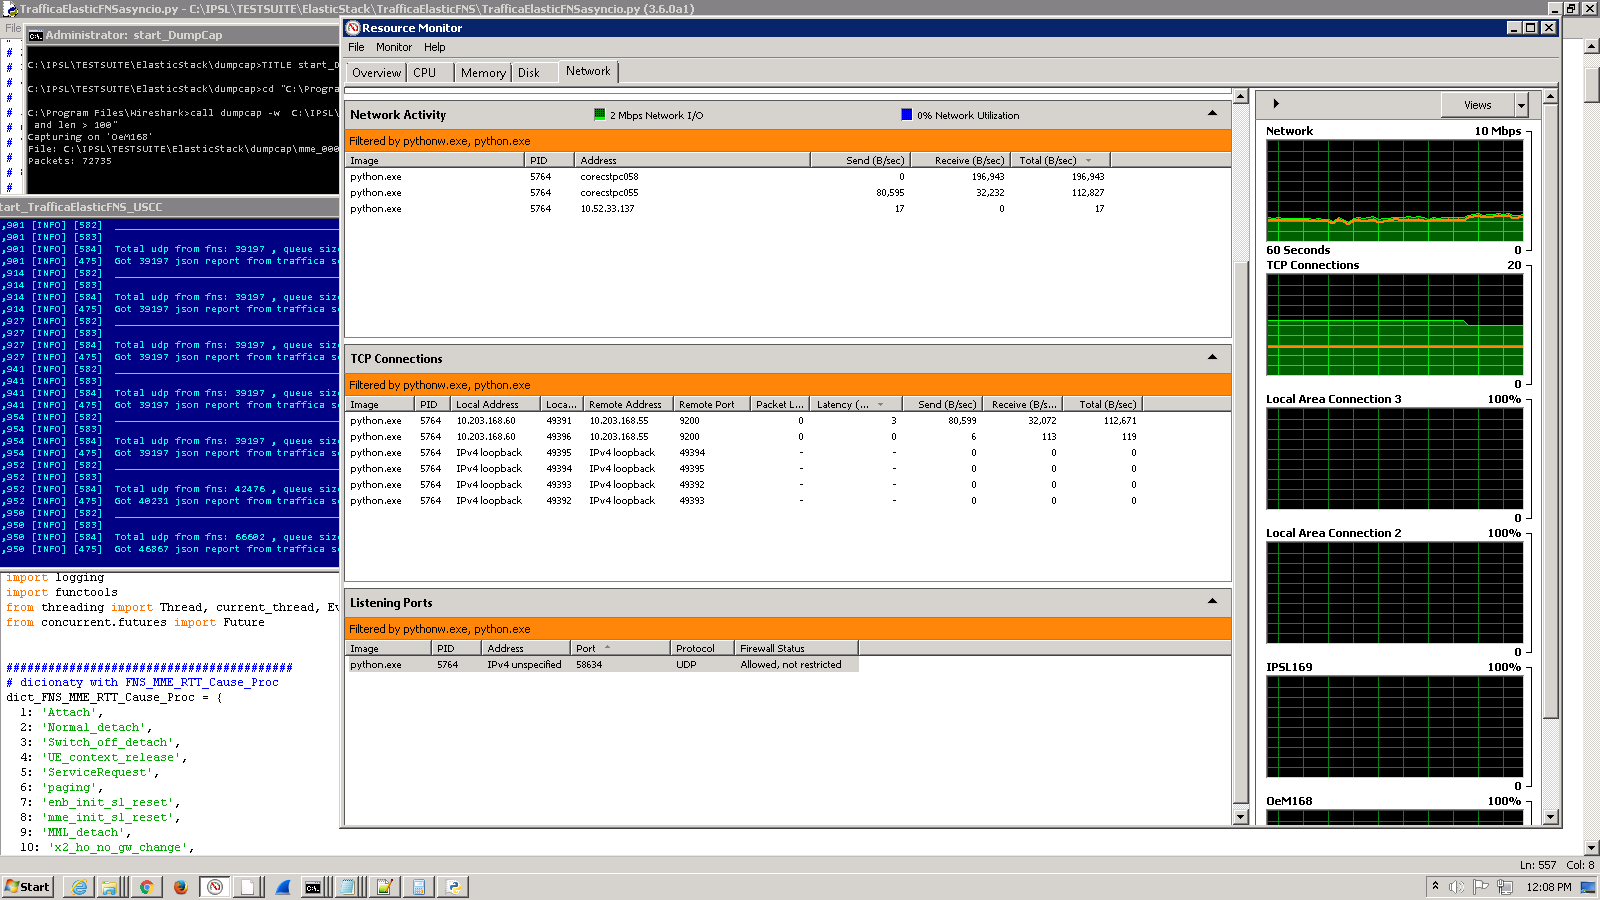
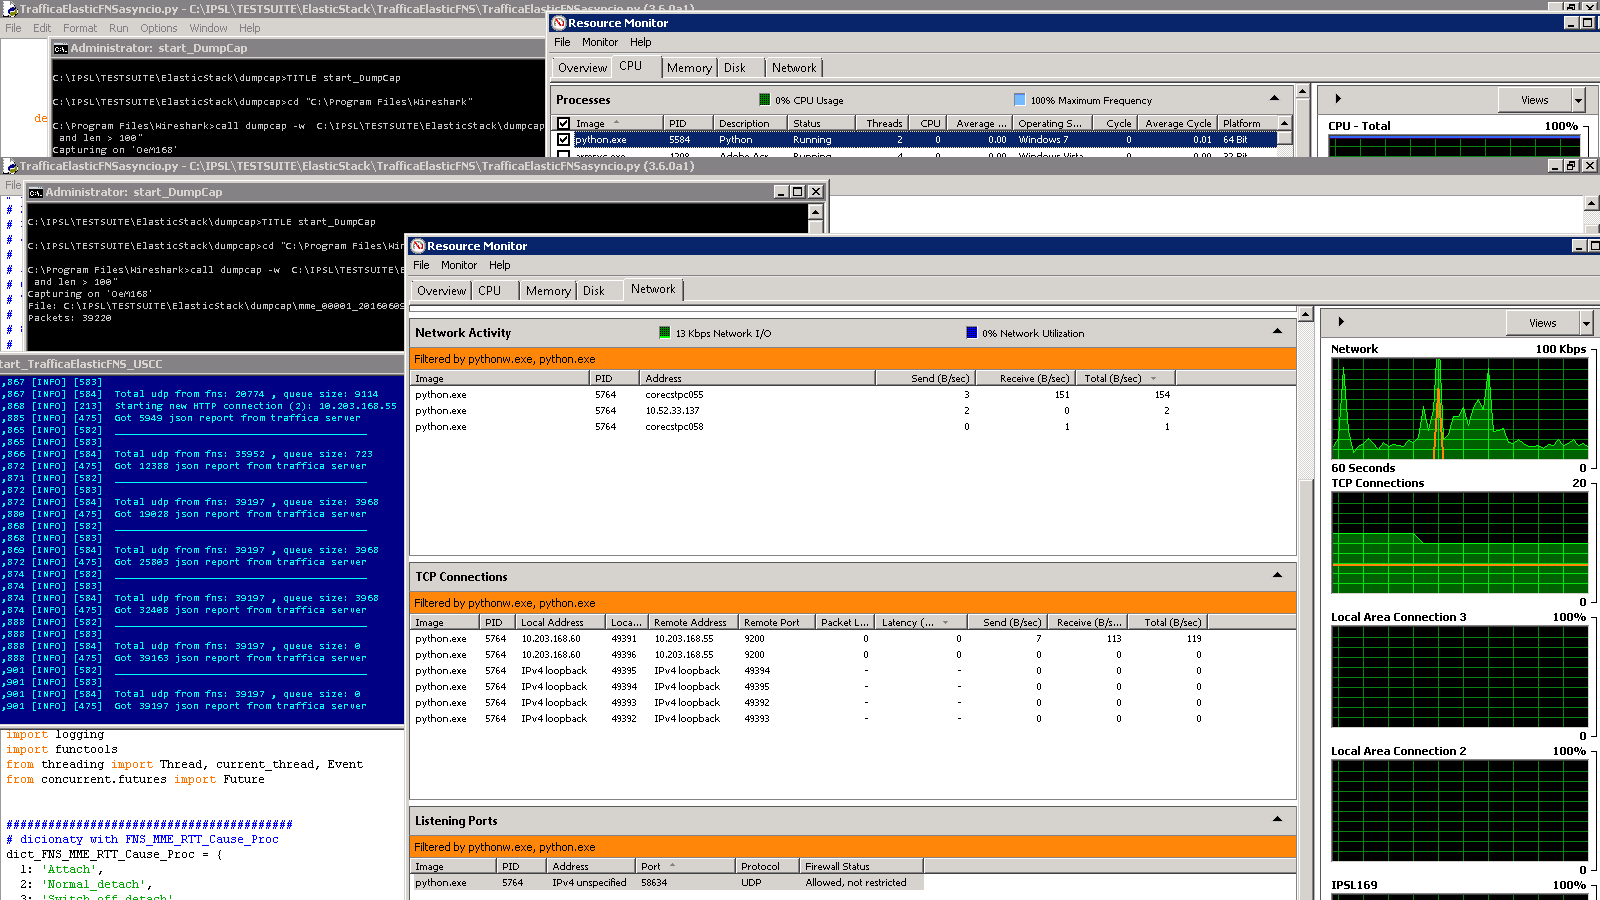
I am monitoring all machines by tcpdump , I do have linux embedded and windows7 and windows server 2012 in this scenario.
tcpdump
163 packets captured
835 packets received by filter
0 packets dropped by kernel
001A-$
tcpdump have this func to report packets dropped by kernel. and in my case it will be always zero.
here is the mismatch that I am always seen during tests:
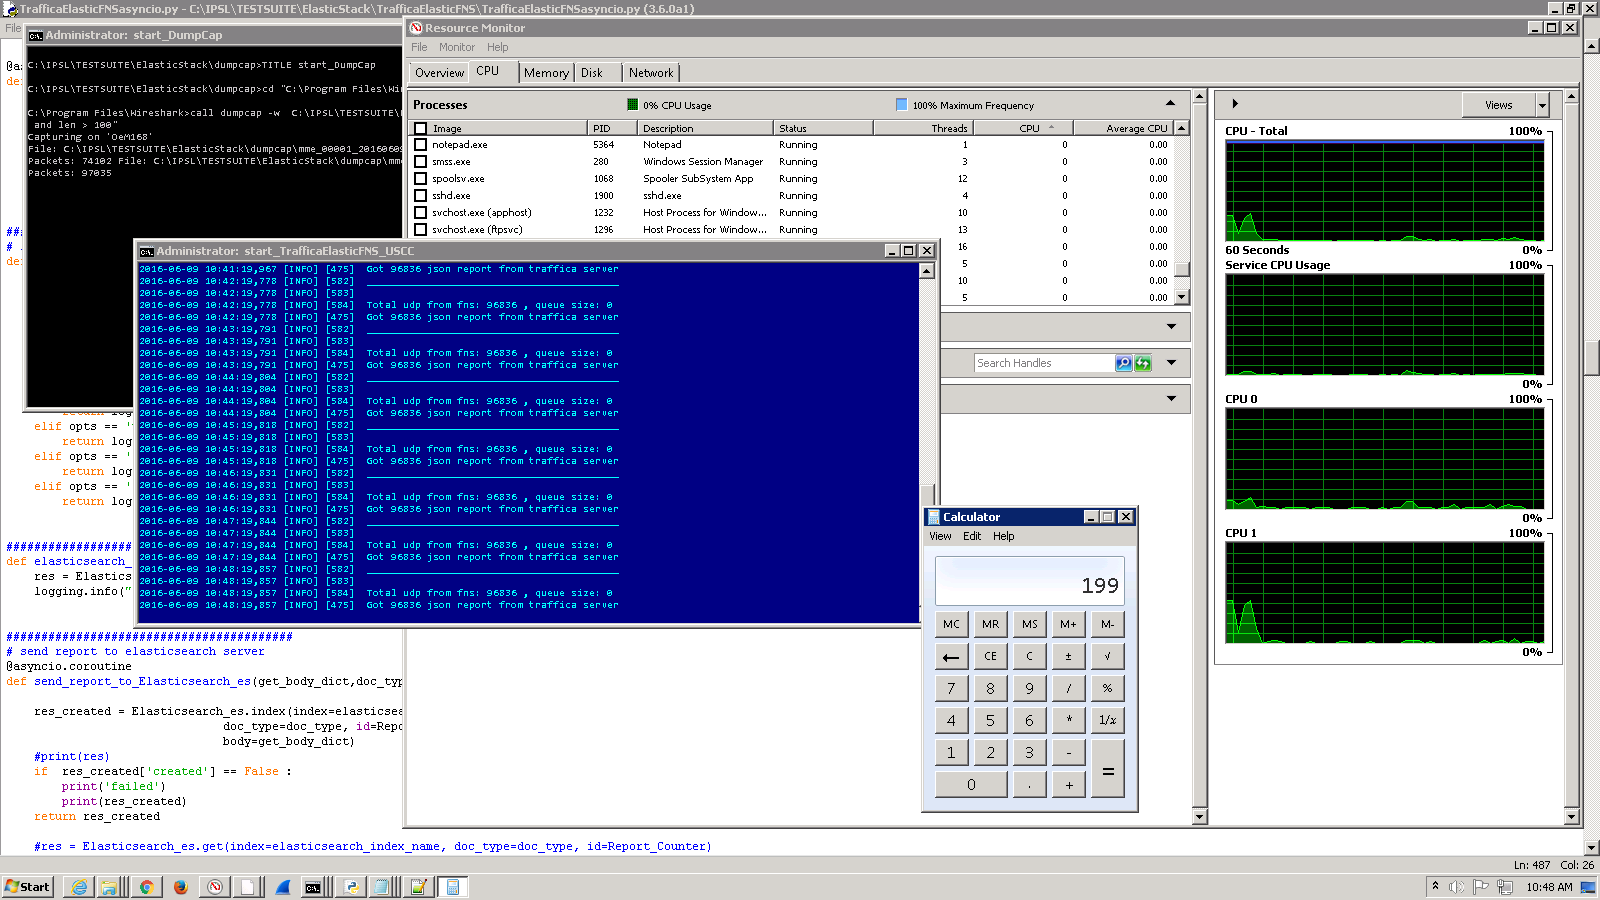
+++
124605 UDP packets send from client.

and received by server network:

tcpdump
Packets: 124605

correct number send and received.  124605

++++++

received by application, I do have a count for all udp received by application:

def datagram_received(self, data, addr):

[2016-06-08 14:59:49] total udp = 124255,queue size =0
[2016-06-08 14:59:49] Got 124255 json report from server.

only 124255 received by application.

124605 - 124255 = 350 udp , received by network card , but application never got it.
we are missing 350 udp.
less udp per second then this problem will disappear. and I am monitoring cpu/memory/network and there is no bottleneck.
+++
now, I have this problem . tcpdump does not show any dropped by kernel, but on asyncio i am not able to debug it.
debug between kernel and datagram_received :
 def datagram_received(self, data, addr):
            asyncio_queue.put_nowait(data)
I do have two threads, main to handle datagram_received add to queue
and another to read from queue and handle tcp/json.
regards!
Valdemar

Yury Selivanov
Jun 9, 2016, 11:05:16 AM6/9/16
to python...@googlegroups.com
On 2016-06-09 9:50 AM, vpavesi wrote:
> I do have two threads, main to handle datagram_received add to queue
> and another to read from queue and handle tcp/json.
>
check how everything is working?
Yury
vpavesi
Jun 9, 2016, 1:13:58 PM6/9/16
to python-tulip
hi Yuri,
best performance is one thread to read-queue udp and another to read from queue and send by tcp.
it is almost perfect! 39220 - 39197 = 23 udp missing
regards!Valdemar
vpavesi
Jun 9, 2016, 2:05:30 PM6/9/16
to python-tulip
001A-$ tcpdump -i vlan645 -f "port 59999"
30013 packets captured
30013 packets received by filter
0 packets dropped by kernel
001A-$
"0 packets dropped by kernel"
It is interesting how kernel tell back to application that
some packets was dropped due application not able to receive.
vpavesi
Jun 10, 2016, 12:46:00 PM6/10/16
to python-tulip
Hello,
now I am testing it on linux and now we do have more info.
2016-06-10 05:52:21,933 [INFO] [574]
2016-06-10 05:52:21,934 [INFO] [575] Total udp from fns: 55727 , queue size: 11665
2016-06-10 05:52:21,938 [INFO] [469] Got 20830 json report from traffica server
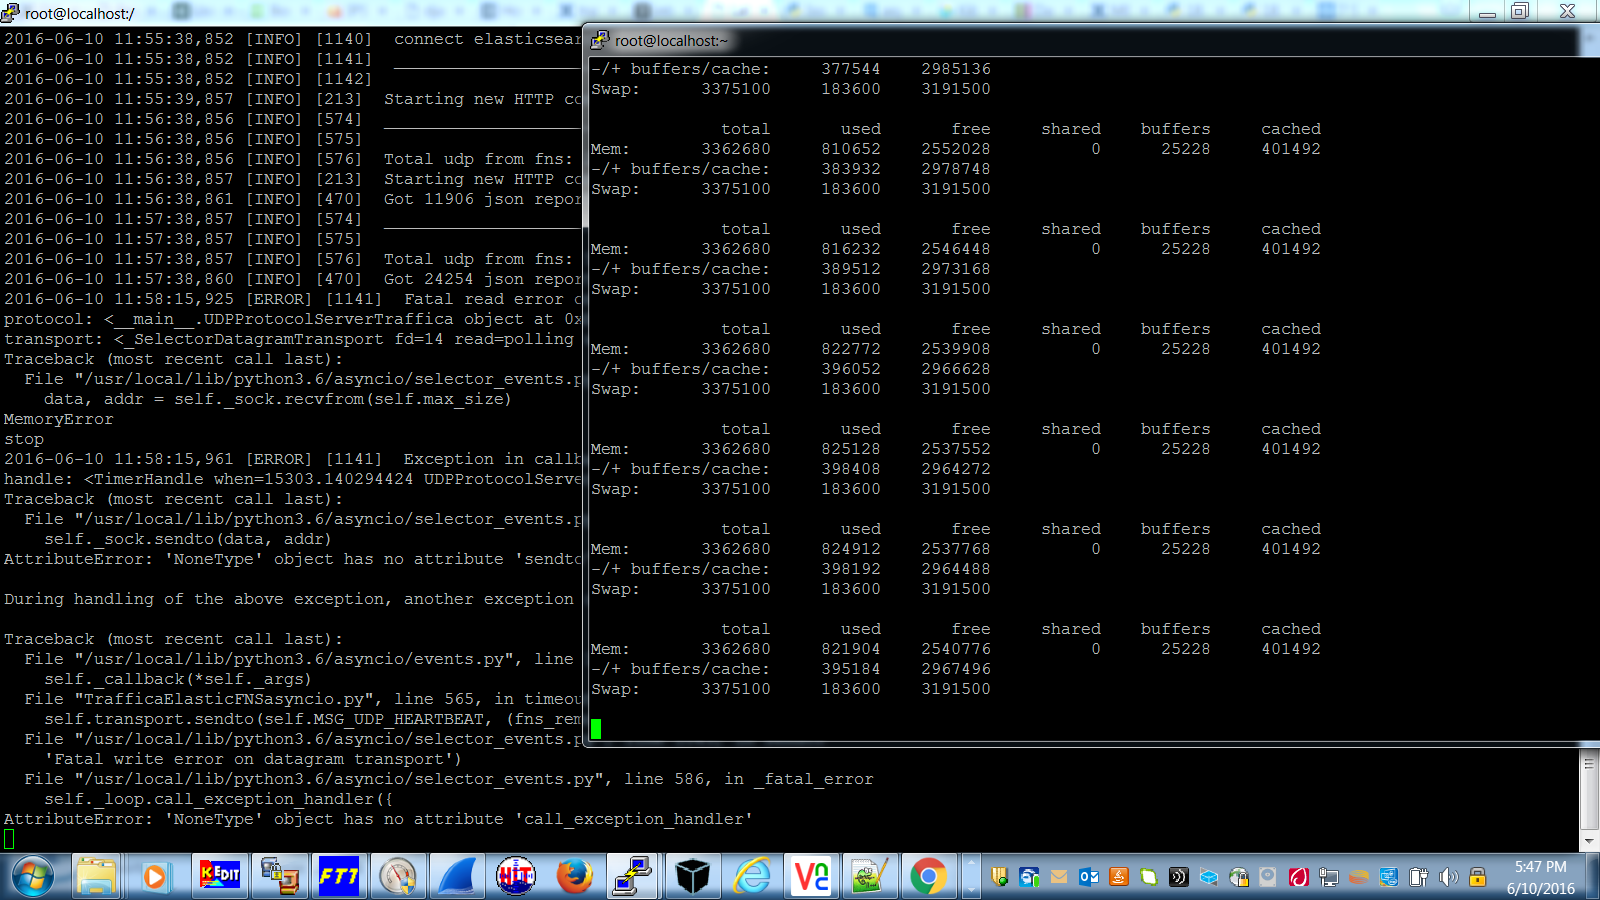
2016-06-10 05:52:57,319 [ERROR] [1141] Fatal read error on datagram transport
protocol: <__main__.UDPProtocolServerTraffica object at 0xb6ef2ccc>
transport: <_SelectorDatagramTransport fd=14 read=polling write=<idle, bufsize=0>>
Traceback (most recent call last):
File "/usr/local/lib/python3.6/asyncio/selector_events.py", line 1001, in _read_ready
data, addr = self._sock.recvfrom(self.max_size)
MemoryError
stop
2016-06-10 05:53:02,339 [ERROR] [1141] Exception in callback UDPProtocolServerTraffica.timeout_heartbeat()
handle: <TimerHandle when=704844.51453486 UDPProtocolServerTraffica.timeout_heartbeat()>
Traceback (most recent call last):
File "/usr/local/lib/python3.6/asyncio/selector_events.py", line 1034, in sendto
self._sock.sendto(data, addr)
AttributeError: 'NoneType' object has no attribute 'sendto'
During handling of the above exception, another exception occurred:
Traceback (most recent call last):
File "/usr/local/lib/python3.6/asyncio/events.py", line 125, in _run
self._callback(*self._args)
File "TrafficaElasticFNSasyncio.py", line 564, in timeout_heartbeat
self.transport.sendto(self.MSG_UDP_HEARTBEAT, (fns_remote_host, fns_remote_port))
File "/usr/local/lib/python3.6/asyncio/selector_events.py", line 1043, in sendto
'Fatal write error on datagram transport')
File "/usr/local/lib/python3.6/asyncio/selector_events.py", line 586, in _fatal_error
self._loop.call_exception_handler({
AttributeError: 'NoneType' object has no attribute 'call_exception_handler'
2016-06-10 05:53:21,953 [INFO] [573] __________________________________________
2016-06-10 05:53:21,953 [INFO] [574]
2016-06-10 05:53:21,953 [INFO] [575] Total udp from fns: 73418 , queue size: 7398
2016-06-10 05:53:21,957 [INFO] [469] Got 32534 json report from traffica server
regards!
Valdemar
vpavesi
Jun 10, 2016, 3:09:32 PM6/10/16
to python-tulip
hi,
should get 77515 udp and got 77500 (datagram_received)
2016-06-10 07:58:31,115 [INFO] [573] __________________________________________
2016-06-10 07:58:31,116 [INFO] [574]
2016-06-10 07:58:31,116 [INFO] [575] Total udp from fns: 77500 , queue size: 0
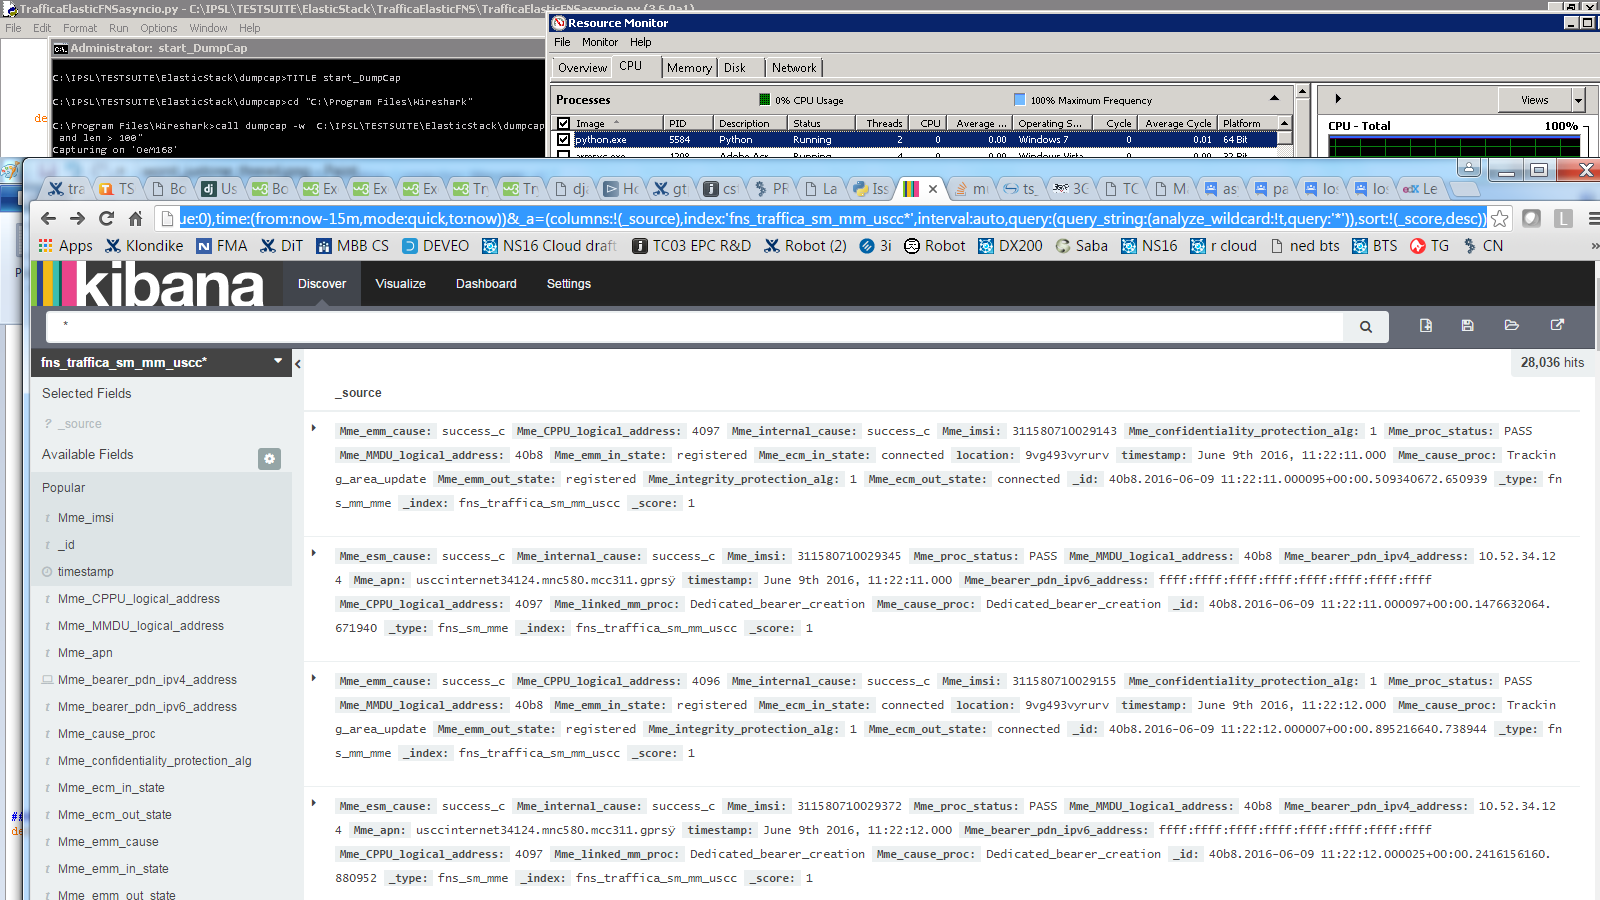
2016-06-10 07:58:31,121 [INFO] [469] Got 77500 json report from elasticsearch
statistics on ethernet:
[root@localhost ~]# ethtool -S em2
NIC statistics:
rx_bytes: 66615299
rx_error_bytes: 0
tx_bytes: 54350283
tx_error_bytes: 0
rx_ucast_packets: 203121
rx_mcast_packets: 0
rx_bcast_packets: 25
tx_ucast_packets: 125729
tx_mcast_packets: 28
tx_bcast_packets: 1
tx_mac_errors: 0
tx_carrier_errors: 0
rx_crc_errors: 0
rx_align_errors: 0
tx_single_collisions: 0
tx_multi_collisions: 0
tx_deferred: 0
tx_excess_collisions: 0
tx_late_collisions: 0
tx_total_collisions: 0
rx_fragments: 0
rx_jabbers: 0
rx_undersize_packets: 0
rx_oversize_packets: 0
rx_64_byte_packets: 676
rx_65_to_127_byte_packets: 62807
rx_128_to_255_byte_packets: 24
rx_256_to_511_byte_packets: 93093
rx_512_to_1023_byte_packets: 46522
rx_1024_to_1522_byte_packets: 24
rx_1523_to_9022_byte_packets: 0
tx_64_byte_packets: 152
tx_65_to_127_byte_packets: 732
tx_128_to_255_byte_packets: 321
tx_256_to_511_byte_packets: 62227
tx_512_to_1023_byte_packets: 62165
tx_1024_to_1522_byte_packets: 161
tx_1523_to_9022_byte_packets: 0
rx_xon_frames: 0
rx_xoff_frames: 0
tx_xon_frames: 0
tx_xoff_frames: 0
rx_mac_ctrl_frames: 0
rx_filtered_packets: 943
rx_ftq_discards: 0
rx_discards: 0
rx_fw_discards: 0
+++
cpu/mem
PID USER PR NI VIRT RES SHR S %CPU %MEM TIME+ COMMAND
2627 root 20 0 80364 56304 3368 S 4.0 1.7 2:20.95 python
and packet size are allways ,len 411 or 506 bytes:
08:10:58.770917 IP 10.52.33.139.59999 > 10.52.39.144.58634: UDP, length 411
08:10:58.776343 IP 10.52.33.139.59999 > 10.52.39.144.58634: UDP, length 506
rx_256_to_511_byte_packets: 93093
++++
and it is clear that kernel will start dropping if application not able to receive , after start recording to text file (putty session) , then tcpdump will start losing packets.
[root@localhost ~]# tcpdump -i em2 -f "port 59999 and len > 100"
2384 packets captured
3004 packets received by filter
612 packets dropped by kernel
[root@localhost ~]#
regards!
Valdemar
vpavesi
Jun 10, 2016, 5:38:17 PM6/10/16
to python-tulip
got it again , looks like there is a collision during read and send ( send will be send every 10 seconds , it is the heartbeat to tell remote machine to keep sending udp)
sendto
data, addr = self._sock.recvfrom(self.max_size)
[root@localhost /]# ./run_traf.sh
2016-06-10 10:38:19,980 [INFO] [1042] to exit press Ctrl+C
2016-06-10 10:38:19,980 [INFO] [1043] Started
2016-06-10 10:38:19,981 [INFO] [1046]
2016-06-10 10:38:19,981 [INFO] [1047] TrafficaElasticFNSasyncio 1.7
2016-06-10 10:38:19,981 [INFO] [1048] __________________________________________
2016-06-10 10:38:19,981 [INFO] [1049]
2016-06-10 10:38:19,981 [INFO] [1050] fns:
2016-06-10 10:38:19,981 [INFO] [1051] ipaddr = 10.52.33.137
2016-06-10 10:38:19,982 [INFO] [1052] port udp = 60000
2016-06-10 10:38:19,982 [INFO] [1053]
2016-06-10 10:38:19,982 [INFO] [1054] __________________________________________
2016-06-10 10:38:19,982 [INFO] [1055]
2016-06-10 10:38:19,982 [INFO] [1056] elasticsearch:
2016-06-10 10:38:19,982 [INFO] [1057] ipaddr = 10.203.168.55
2016-06-10 10:38:19,982 [INFO] [1058] port tcp = 9200
2016-06-10 10:38:19,982 [INFO] [1059]
2016-06-10 10:38:19,983 [INFO] [1060] __________________________________________
2016-06-10 10:38:19,983 [INFO] [1061] me:
2016-06-10 10:38:19,983 [INFO] [1062] ipaddr = 0.0.0.0
2016-06-10 10:38:19,983 [INFO] [1063] port udp = 58634
2016-06-10 10:38:19,983 [INFO] [1064] __________________________________________
2016-06-10 10:38:19,983 [INFO] [1065]
2016-06-10 10:38:19,983 [INFO] [1067] OS info:
2016-06-10 10:38:19,983 [INFO] [1068] Endianness = little
2016-06-10 10:38:19,988 [INFO] [1069] OS = Linux.3.12.11-201.fc19.i686 linux
2016-06-10 10:38:19,988 [INFO] [1070] Machine = i686
2016-06-10 10:38:19,988 [INFO] [1071] Node = localhost.localdomain
2016-06-10 10:38:19,989 [INFO] [1072] Processor = i686
2016-06-10 10:38:19,989 [INFO] [1073] Python version = 3.6.0a1
2016-06-10 10:38:19,989 [INFO] [1074] __________________________________________
2016-06-10 10:38:19,989 [INFO] [1075]
2016-06-10 10:38:19,990 [INFO] [213] Starting new HTTP connection (1): 10.203.168.55
2016-06-10 10:38:19,997 [INFO] [63] GET http://10.203.168.55:9200/_nodes/_all/clear [status:200 request:0.007s]
2016-06-10 10:38:20,987 [INFO] [63] DELETE http://10.203.168.55:9200/fns_traffica_sm_mm_uscc [status:200 request:0.990s]
2016-06-10 10:38:21,628 [INFO] [63] PUT http://10.203.168.55:9200/fns_traffica_sm_mm_uscc [status:200 request:0.641s]
2016-06-10 10:38:21,998 [INFO] [63] PUT http://10.203.168.55:9200/fns_traffica_sm_mm_uscc/_mapping/fns_sm_mme [status:200 request:0.370s]
2016-06-10 10:38:22,038 [INFO] [63] PUT http://10.203.168.55:9200/fns_traffica_sm_mm_uscc/_mapping/fns_mm_mme [status:200 request:0.039s]
2016-06-10 10:38:22,038 [INFO] [1139] connect traffica
2016-06-10 10:38:22,039 [INFO] [1140] connect elasticsearch
2016-06-10 10:38:22,039 [INFO] [1141] __________________________________________
2016-06-10 10:38:22,039 [INFO] [1142]
2016-06-10 10:39:03,089 [INFO] [213] Starting new HTTP connection (2): 10.203.168.55
2016-06-10 10:39:22,052 [INFO] [574] __________________________________________
2016-06-10 10:39:22,052 [INFO] [575]
2016-06-10 10:39:22,052 [INFO] [576] Total udp from fns: 1420 , queue size: 0
2016-06-10 10:39:22,072 [INFO] [470] Got 1420 json report from traffica server
2016-06-10 10:40:22,060 [INFO] [574] __________________________________________
2016-06-10 10:40:22,060 [INFO] [575]
2016-06-10 10:40:22,060 [INFO] [576] Total udp from fns: 4487 , queue size: 0
2016-06-10 10:40:22,087 [INFO] [470] Got 4487 json report from traffica server
2016-06-10 10:41:22,071 [INFO] [574] __________________________________________
2016-06-10 10:41:22,071 [INFO] [575]
2016-06-10 10:41:22,071 [INFO] [576] Total udp from fns: 5165 , queue size: 0
2016-06-10 10:41:22,076 [INFO] [470] Got 5165 json report from traffica server
2016-06-10 10:42:22,071 [INFO] [574] __________________________________________
2016-06-10 10:42:22,071 [INFO] [575]
2016-06-10 10:42:22,071 [INFO] [576] Total udp from fns: 15627 , queue size: 5206
2016-06-10 10:42:22,072 [INFO] [213] Starting new HTTP connection (3): 10.203.168.55
2016-06-10 10:42:22,081 [INFO] [470] Got 10321 json report from traffica server
2016-06-10 10:43:22,072 [INFO] [574] __________________________________________
2016-06-10 10:43:22,072 [INFO] [575]
2016-06-10 10:43:22,072 [INFO] [576] Total udp from fns: 41640 , queue size: 20660
2016-06-10 10:43:22,106 [INFO] [470] Got 20918 json report from traffica server
2016-06-10 10:44:22,073 [INFO] [574] __________________________________________
2016-06-10 10:44:22,074 [INFO] [575]
2016-06-10 10:44:22,074 [INFO] [576] Total udp from fns: 71635 , queue size: 38649
2016-06-10 10:44:22,083 [INFO] [470] Got 32878 json report from traffica server
2016-06-10 10:44:47,155 [ERROR] [1141] Fatal read error on datagram transport
protocol: <__main__.UDPProtocolServerTraffica object at 0xb6edbd2c>
transport: <_SelectorDatagramTransport fd=14 read=polling write=<idle, bufsize=0>>
Traceback (most recent call last):
File "/usr/local/lib/python3.6/asyncio/selector_events.py", line 1001, in _read_ready
data, addr = self._sock.recvfrom(self.max_size)
MemoryError
stop
2016-06-10 10:44:52,187 [ERROR] [1141] Exception in callback UDPProtocolServerTraffica.timeout_heartbeat()
handle: <TimerHandle when=10899.361216256 UDPProtocolServerTraffica.timeout_heartbeat()>
Traceback (most recent call last):
File "/usr/local/lib/python3.6/asyncio/selector_events.py", line 1034, in sendto
self._sock.sendto(data, addr)
AttributeError: 'NoneType' object has no attribute 'sendto'
During handling of the above exception, another exception occurred:
Traceback (most recent call last):
File "/usr/local/lib/python3.6/asyncio/events.py", line 125, in _run
self._callback(*self._args)
File "TrafficaElasticFNSasyncio.py", line 565, in timeout_heartbeat
self.transport.sendto(self.MSG_UDP_HEARTBEAT, (fns_remote_host, fns_remote_port))
File "/usr/local/lib/python3.6/asyncio/selector_events.py", line 1043, in sendto
'Fatal write error on datagram transport')
File "/usr/local/lib/python3.6/asyncio/selector_events.py", line 586, in _fatal_error
self._loop.call_exception_handler({
AttributeError: 'NoneType' object has no attribute 'call_exception_handler'
2016-06-10 10:45:22,104 [INFO] [574] __________________________________________
2016-06-10 10:45:22,105 [INFO] [575]
2016-06-10 10:45:22,105 [INFO] [576] Total udp from fns: 84176 , queue size: 39487
2016-06-10 10:45:22,108 [INFO] [470] Got 44544 json report from traffica server
vpavesi
Jun 10, 2016, 6:27:00 PM6/10/16
to python-tulip
strace during the exception. ( errors 6 mmap2 and 3 ioctl )
[root@localhost ~]# strace -p 5023 -q -f -c
^C% time seconds usecs/call calls errors syscall
------ ----------- ----------- --------- --------- ----------------
67.22 16.287312 199 81737 poll
20.08 4.866613 92 52964 epoll_wait
12.18 2.951751 5 574504 98531 futex
0.15 0.037130 0 108647 gettimeofday
0.14 0.034103 0 505551 clock_gettime
0.07 0.017914 0 40868 send
0.05 0.011846 0 52897 mremap
0.03 0.008090 0 52900 recvfrom
0.03 0.006306 0 52904 6 mmap2
0.01 0.002889 0 20439 3 ioctl
0.01 0.002277 0 20436 recv
0.01 0.002231 0 20533 munmap
0.01 0.002000 1000 2 restart_syscall
0.00 0.001007 0 20447 stat64
0.00 0.000052 0 106 sendto
0.00 0.000000 0 20 read
0.00 0.000000 0 14 write
0.00 0.000000 0 4 open
0.00 0.000000 0 5 close
0.00 0.000000 0 1 time
0.00 0.000000 0 2 brk
0.00 0.000000 0 6 _llseek
0.00 0.000000 0 3 fstat64
0.00 0.000000 0 1 epoll_ctl
0.00 0.000000 0 1 socket
0.00 0.000000 0 1 1 connect
0.00 0.000000 0 1 setsockopt
0.00 0.000000 0 1 getsockopt
------ ----------- ----------- --------- --------- ----------------
100.00 24.231521 1604995 98541 total
[root@localhost ~]#
2016-06-10 11:30:30,756 [INFO] [576] Total udp from fns: 59995 , queue size: 38296
2016-06-10 11:30:30,763 [INFO] [470] Got 21579 json report from traffica server
2016-06-10 11:30:54,198 [ERROR] [1141] Fatal read error on datagram transport
protocol: <__main__.UDPProtocolServerTraffica object at 0xb6ee8d2c>
transport: <_SelectorDatagramTransport fd=14 read=polling write=<idle, bufsize=0>>
Traceback (most recent call last):
File "/usr/local/lib/python3.6/asyncio/selector_events.py", line 1001, in _read_ready
data, addr = self._sock.recvfrom(self.max_size)
MemoryError
stop
2016-06-10 11:30:54,930 [ERROR] [1141] Exception in callback UDPProtocolServerTraffica.timeout_heartbeat()
handle: <TimerHandle when=13662.108784672 UDPProtocolServerTraffica.timeout_heartbeat()>
Traceback (most recent call last):
File "/usr/local/lib/python3.6/asyncio/selector_events.py", line 1034, in sendto
self._sock.sendto(data, addr)
AttributeError: 'NoneType' object has no attribute 'sendto'
During handling of the above exception, another exception occurred:
Traceback (most recent call last):
File "/usr/local/lib/python3.6/asyncio/events.py", line 125, in _run
self._callback(*self._args)
File "TrafficaElasticFNSasyncio.py", line 565, in timeout_heartbeat
self.transport.sendto(self.MSG_UDP_HEARTBEAT, (fns_remote_host, fns_remote_port))
File "/usr/local/lib/python3.6/asyncio/selector_events.py", line 1043, in sendto
'Fatal write error on datagram transport')
File "/usr/local/lib/python3.6/asyncio/selector_events.py", line 586, in _fatal_error
self._loop.call_exception_handler({
AttributeError: 'NoneType' object has no attribute 'call_exception_handler'
2016-06-10 11:31:30,782 [INFO] [574] __________________________________________
2016-06-10 11:31:30,782 [INFO] [575]
2016-06-10 11:31:30,782 [INFO] [576] Total udp from fns: 71716 , queue size: 39029
2016-06-10 11:31:30,785 [INFO] [470] Got 32554 json report from traffica server
2016-06-10 11:32:30,842 [INFO] [574] __________________________________________
2016-06-10 11:32:30,842 [INFO] [575]
2016-06-10 11:32:30,842 [INFO] [576] Total udp from fns: 71716 , queue size: 26767
2016-06-10 11:32:30,845 [INFO] [470] Got 44882 json report from traffica server
++++
after get this exception then there are no more heartbeat and remote machine will stops ending udp.
queue will be all processed.
2016-06-10 11:31:30,782 [INFO] [574] __________________________________________
2016-06-10 11:31:30,782 [INFO] [575]
2016-06-10 11:31:30,782 [INFO] [576] Total udp from fns: 71716 , queue size: 39029
2016-06-10 11:31:30,785 [INFO] [470] Got 32554 json report from traffica server
2016-06-10 11:32:30,842 [INFO] [574] __________________________________________
2016-06-10 11:32:30,842 [INFO] [575]
2016-06-10 11:32:30,842 [INFO] [576] Total udp from fns: 71716 , queue size: 26767
2016-06-10 11:32:30,845 [INFO] [470] Got 44882 json report from traffica server
2016-06-10 11:33:30,902 [INFO] [574] __________________________________________
2016-06-10 11:33:30,902 [INFO] [575]
2016-06-10 11:33:30,903 [INFO] [576] Total udp from fns: 71716 , queue size: 14777
2016-06-10 11:33:30,906 [INFO] [470] Got 56797 json report from traffica server
2016-06-10 11:34:30,963 [INFO] [574] __________________________________________
2016-06-10 11:34:30,963 [INFO] [575]
2016-06-10 11:34:30,963 [INFO] [576] Total udp from fns: 71716 , queue size: 2650
2016-06-10 11:34:30,970 [INFO] [470] Got 68974 json report from traffica server
2016-06-10 11:35:31,024 [INFO] [574] __________________________________________
2016-06-10 11:35:31,024 [INFO] [575]
2016-06-10 11:35:31,024 [INFO] [576] Total udp from fns: 71716 , queue size: 0
2016-06-10 11:35:31,029 [INFO] [470] Got 71716 json report from traffica server
++++++
strace without problems:
[root@localhost ~]# strace -p 5047 -q -f -c
^C% time seconds usecs/call calls errors syscall
------ ----------- ----------- --------- --------- ----------------
65.98 8.198575 214 38329 poll
20.43 2.538010 95 26826 epoll_wait
13.12 1.630677 6 291448 47829 futex
0.13 0.015724 0 55899 gettimeofday
0.13 0.015583 0 248718 clock_gettime
0.08 0.010247 1 19165 send
0.05 0.006453 0 26799 mremap
0.03 0.003963 0 26799 mmap2
0.02 0.002766 0 26799 recvfrom
0.01 0.001310 0 9634 munmap
0.01 0.001306 0 9584 ioctl
0.01 0.000833 0 9582 recv
0.00 0.000282 0 9586 stat64
0.00 0.000037 37 1 1 connect
0.00 0.000000 0 1 restart_syscall
0.00 0.000000 0 5 write
0.00 0.000000 0 1 socket
0.00 0.000000 0 53 sendto
0.00 0.000000 0 1 setsockopt
0.00 0.000000 0 1 getsockopt
------ ----------- ----------- --------- --------- ----------------
100.00 12.425766 799231 47830 total
[root@localhost ~]#
vpavesi
Jun 10, 2016, 6:42:25 PM6/10/16
to python-tulip
all errors:
[root@localhost ~]# strace -p 5109 -q -f -e mmap2,ioctl -r -i -x -y -o /strace_pid_5109.txt
5109 0.000855 [b7800424] mmap2(NULL, 266240, PROT_READ|PROT_WRITE, MAP_PRIVATE|MAP_ANONYMOUS, -1, 0) = -1 ENOMEM (Cannot allocate memory)
5109 0.000136 [b7800424] mmap2(NULL, 266240, PROT_READ|PROT_WRITE, MAP_PRIVATE|MAP_ANONYMOUS, -1, 0) = -1 ENOMEM (Cannot allocate memory)
5109 0.000095 [b7800424] mmap2(NULL, 1048576, PROT_READ|PROT_WRITE, MAP_PRIVATE|MAP_ANONYMOUS, -1, 0) = -1 ENOMEM (Cannot allocate memory)
5109 0.000169 [b7800424] mmap2(NULL, 2097152, PROT_NONE, MAP_PRIVATE|MAP_ANONYMOUS|MAP_NORESERVE, -1, 0) = -1 ENOMEM (Cannot allocate memory)
5109 0.000041 [b7800424] mmap2(NULL, 1048576, PROT_NONE, MAP_PRIVATE|MAP_ANONYMOUS|MAP_NORESERVE, -1, 0) = -1 ENOMEM (Cannot allocate memory)
5109 0.000048 [b7800424] mmap2(NULL, 2097152, PROT_NONE, MAP_PRIVATE|MAP_ANONYMOUS|MAP_NORESERVE, -1, 0) = -1 ENOMEM (Cannot allocate memory)
5109 0.000042 [b7800424] mmap2(NULL, 1048576, PROT_NONE, MAP_PRIVATE|MAP_ANONYMOUS|MAP_NORESERVE, -1, 0) = -1 ENOMEM (Cannot allocate memory)
5109 0.000757 [b7800424] ioctl(17</usr/local/lib/python3.6/asyncio/selector_events.py>, SNDCTL_TMR_TIMEBASE or SNDRV_TIMER_IOCTL_NEXT_DEVICE or TCGETS, 0xbffd9708) = -1 ENOTTY (Inappropriate ioctl for device)
5109 0.002338 [b7800424] ioctl(14</usr/local/lib/python3.6/asyncio/events.py>, SNDCTL_TMR_TIMEBASE or SNDRV_TIMER_IOCTL_NEXT_DEVICE or TCGETS, 0xbffd9a08) = -1 ENOTTY (Inappropriate ioctl for device)
5109 0.000692 [b7800424] ioctl(14</TrafficaElasticFNSasyncio.py>, SNDCTL_TMR_TIMEBASE or SNDRV_TIMER_IOCTL_NEXT_DEVICE or TCGETS, 0xbffd9a08) = -1 ENOTTY (Inappropriate ioctl for device)
vpavesi
Jun 10, 2016, 6:51:24 PM6/10/16
to python-tulip
i am sorry about all reply.
we had free memory during the exception:
[root@localhost ~]# free -s 5
total used free shared buffers cached
Mem: 3362680 700188 2662492 0 25252 401500
-/+ buffers/cache: 273436 3089244
Swap: 3375100 183596 3191504
vpavesi
Jun 22, 2016, 8:37:51 PM6/22/16
to python-tulip
hello,
some updates!
a) with queue then no UDP will be lost.
def datagram_received(self, data, addr):
asyncio_queue.put_nowait(data)
and read queue is running in 20 threads
async def queue_consume_g():
while True:
if asyncio_queue.qsize() != 0:
try:
data = asyncio_queue.get_nowait()
await process_report_from_queue(data)
except:
pass
else:
await asyncio.sleep(5)
our UDP traffic is constant, it will be send to queue and read from queue and processed and send by tcp to server. 20 threads and 20 tcp connections to server.
but UDP still fast than TCP. and 20 threads reading from queue , but I cannot find a way to accelerate it. 40 threads make no difference.
our queue will keep growing and after reach 40k then we got crash ( mmap).
b) to avoid queue to increase to infinity , there is new sleep 1 second. during 1 seconds all UDP packets received by network will be dropped.
def datagram_received(self, data, addr):
if asyncio_queue.qsize() > 10000:
time.sleep(1)
asyncio_queue.put_nowait(data)
else:
asyncio_queue.put_nowait(data)
our data is from a sensors , there is NO big problem to loose some samples , sure we would like to have 100% perfect. but cannot find a way to accelerate the read queue and send it by tcp.
able to receive 50 millions samples wihtout any crash.
c) still not able to change RECEIVE buffer on asncio.
socket.setsockopt(socket.SOL_SOCKET, socket.SO_RCVBUF, 2**30)
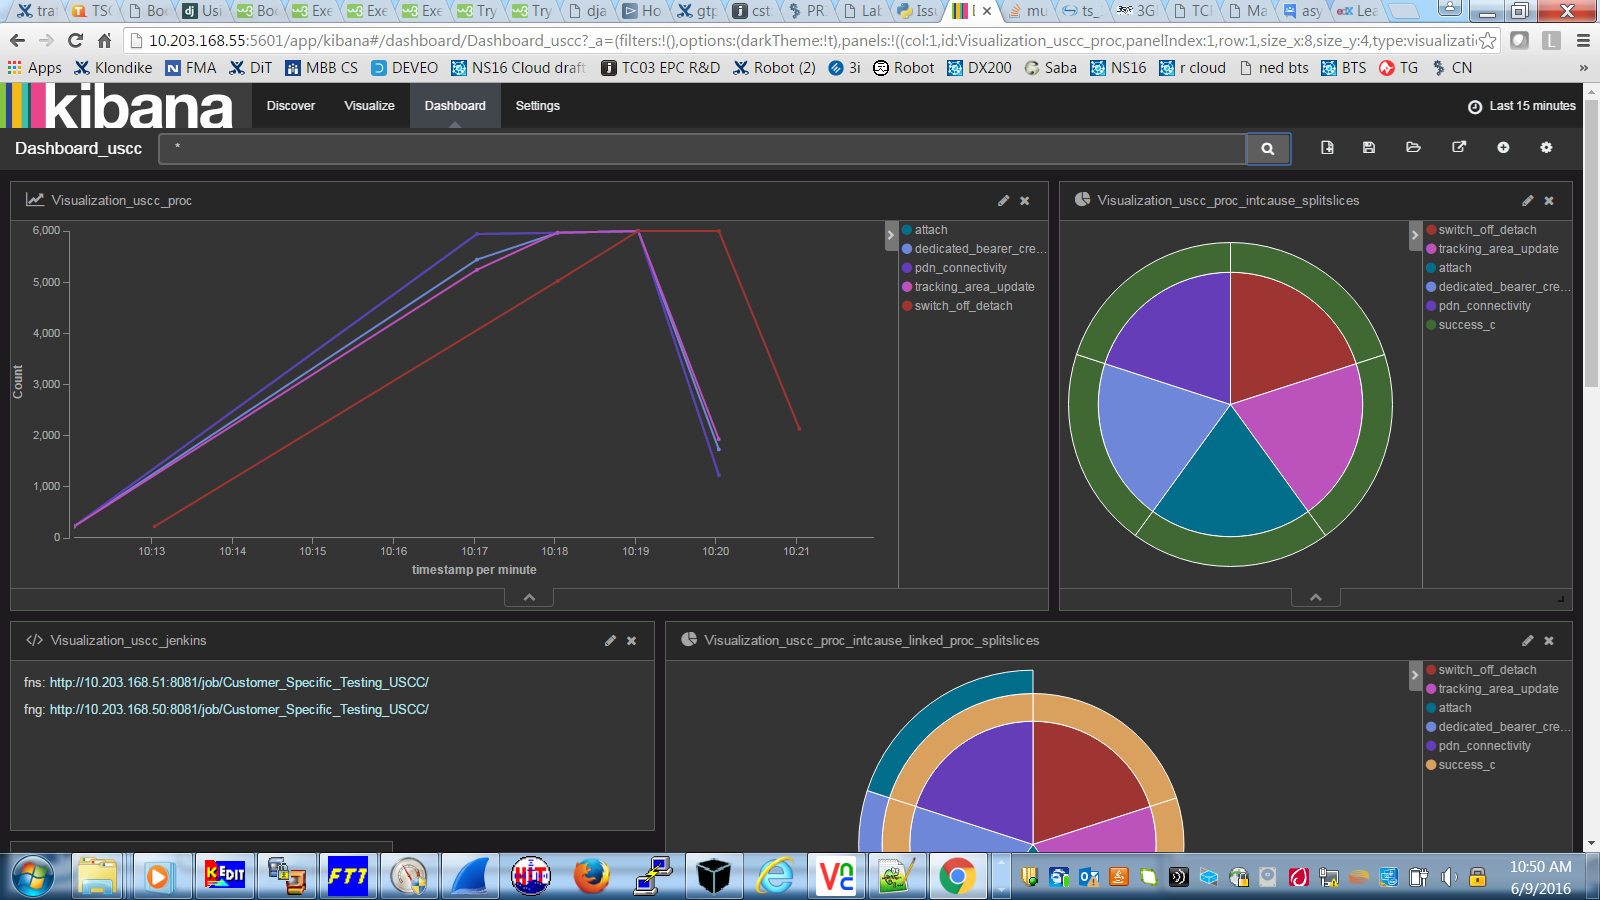
on graph. black line are udp received and red are tcp send to server. if tcp is not processed faster than udp then queue will keep growing...

regards!
Valdemar
vpavesi
Jun 22, 2016, 11:00:14 PM6/22/16
to python-tulip
Hello,


found a solution for it. using bulk , 70 UDP( 500 bytes each) will be added into one TCP.
HTTP 46675 bytes POST /_bulk HTTP/1.1
now TCP is faster than UDP.

data processed looks perfect:

Reply all
Reply to author
Forward
0 new messages