breakpoint/segmented regression

Andreas Hilboll
I want to do some breakpoint estimation, i.e. fit a piecewise linear
function to my data, applying weights. According to wikipedia, the term
seems to be "segmented regression":
http://en.wikipedia.org/wiki/Segmented_regression
Is there something for this already in statsmodels? If not, do you have
an idea how to do this? Would it fit into statsmodels? Where should I
start implementing?
Cheers, Andreas.

josef...@gmail.com
First what's easy to do: Running separate regressions, or regression
with some changes in regression coefficients at known change points is
relatively easy to do. We have the Chow test to test whether a break
occured at a known point.
(I have a class OneWayGLS in the sandbox, that collects some results
for this, when all coefficients change.)
continuous regression line:
As far as I remember, if you just run separate regression in each
segment, then the fitted lines won't match up at the break points. I'm
not even sure what it means to have a continuous regression line with
several regressors/x-variables. (never looked at it).
If it's just one regressor, then this looks the same as a linear
spline and shouldn't be very difficult.
My "impression" is that this either needs restricted least squares or
a parameterization that the line segments connect (linear spline basis
functions). My guess is it's not too difficult to come up with the
required restrictions or the right parameterization.
exog = np.column_stack([maximum (0, x - breakpoint) for breakpoint in
breakpoints]) ?
unknown break points:
There are statistical tests whether at a break (at arbitrary point)
occured, and estimates for the break point location, but there is only
a little bit for the first, and nothing for the estimation of the
break point location available in statsmodels.
If you can tell more specific requirements, then I might be able to
point you better in a direction.
Josef
>
> Cheers, Andreas.
josef...@gmail.com
a quick first try,
---------------------------------
# -*- coding: utf-8 -*-
"""Segmented Regression - First trial version
Created on Fri Mar 29 07:52:10 2013
Author: Josef Perktold
"""
import numpy as np
import statsmodels.api as sm
import matplotlib.pyplot as plt
nobs = 100
sig_e = 0.2
x = np.random.uniform(0, 10, nobs)
x.sort()
breaks = [0, 2, 5, 8] # 0 adds slope for entire array
exog = np.column_stack([np.maximum(0, x - knot) for knot in breaks])
exog = sm.add_constant(exog)
beta = np.array([1, 0.5, -0.8, 0.2, 1.])
y_true = np.dot(exog, beta)
endog = y_true + sig_e * np.random.randn(nobs)
weights = np.ones(nobs)
weights[nobs//2:] *= 1.5**2
res = sm.WLS(endog, exog, weights=weights).fit()
print 'params:'
print 'DGP: ', beta
print 'WLS: ', res.params
print '\nslopes:'
print 'DGP: ', beta[1:].cumsum()
print 'WLS: ', res.params[1:].cumsum()
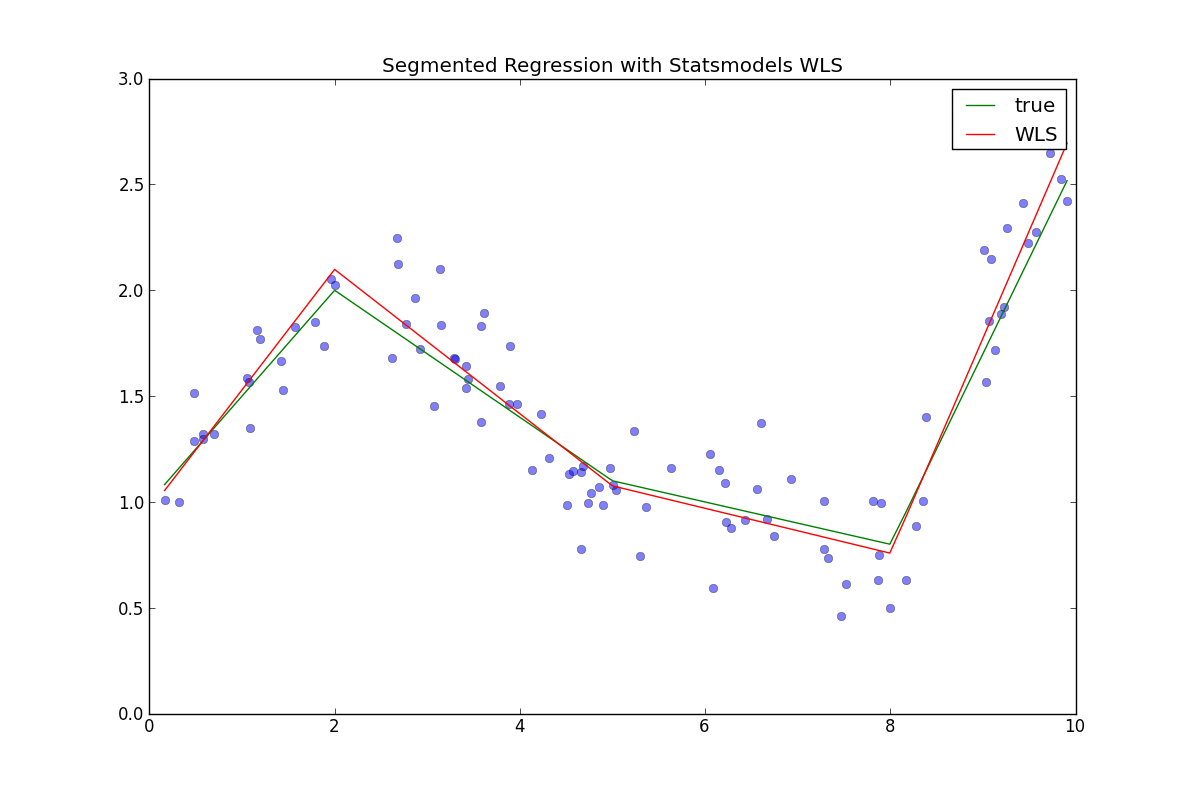
plt.plot(x, endog, 'o', alpha=0.5)
plt.plot(x, y_true, label='true')
plt.plot(x, res.fittedvalues, label='WLS')
plt.legend()
plt.title('Segmented Regression with Statsmodels WLS')
plt.show()
----------------------------------
Josef
>
> Josef
>
>>
>> Cheers, Andreas.
josef...@gmail.com
WLS Regression Results
==============================================================================
Dep. Variable: y R-squared: 0.879
Model: WLS Adj. R-squared: 0.874
Method: Least Squares F-statistic: 172.0
Date: Fri, 29 Mar 2013 Prob (F-statistic): 1.32e-42
Time: 08:30:16 Log-Likelihood: -0.81151
No. Observations: 100 AIC: 11.62
Df Residuals: 95 BIC: 24.65
Df Model: 4
==============================================================================
coef std err t P>|t| [95.0% Conf. Int.]
------------------------------------------------------------------------------
const 0.9119 0.087 10.500 0.000 0.740 1.084
x1 0.4983 0.066 7.530 0.000 0.367 0.630
x2 -0.7539 0.092 -8.213 0.000 -0.936 -0.572
x3 -0.0905 0.056 -1.629 0.107 -0.201 0.020
x4 1.0893 0.063 17.228 0.000 0.964 1.215
==============================================================================
Omnibus: 2.640 Durbin-Watson: 2.405
Prob(Omnibus): 0.267 Jarque-Bera (JB): 2.652
Skew: 0.367 Prob(JB): 0.266
Kurtosis: 2.685 Cond. No. 63.0
==============================================================================
>>>
josef...@gmail.com
# a different parameterization
segment_dummy = x[:,None] >= breaks
x2 = (x[:,None] - breaks) * segment_dummy # same as first exog without constant
x3 = x2[:, :-1] - x2[:, 1:]
exog2 = np.column_stack([np.ones(nobs), x3, x2[:, -1]])
res2 = sm.WLS(endog, exog2, weights=weights).fit()
print 'params:'
print 'DGP: ', beta[0], beta[1:].cumsum()
print 'WLS: ', res2.params
# linear algebra for reparameterization
conv2slope = np.arange(5)[:, None] >= np.arange(5)
conv2slope[1:, 0] = 0
convinv = np.linalg.inv(conv2slope)
params_slope = np.dot(conv2slope, res.params)
print "slope param", params_slope
print 'reparameterization error slopes', params_slope - params_sl
exog2a = np.dot(exog, convinv) # slope parameterization
print 'reparameterization error', np.max(np.abs(exog2a -exog2))
---------
>> Josef>>>>> Josef>>>>>>>> Cheers, Andreas.
Andreas Hilboll
I'm always amazed at how quickly you come up with realy good answers --
thanks a lot, again!
However, in my use case, I don't know a-priori the locations of the
breakpoints. I quickly hacked together something along these lines,
using scipy.optimize.minimize:
---8<-------
import numpy as np
import numpy.ma as ma
import pandas as pd
from scipy.optimize import minimize
import matplotlib.pyplot as plt
def F(X, data, S):
# y1, y2, y3, t2 are scalars, data is a constant np.array
y1, y2, y3, t2 = X
T = np.arange(data.size)
t1, t3 = T[0], T[-1]
Xbefore = y1 + (T - t1) * (y2 - y1) / (t2 - t1)
Xafter = y2 + (T - t2) * (y3 - y2) / (t3 - t2)
Xbreak = np.where(T <= t2, Xbefore, Xafter)
return ((ma.masked_invalid(Xbreak - data)**2) /
ma.masked_invalid(S)**2).sum()
# create test data
idx = pd.period_range("2000-01", "2009-12", freq="M")
data1 = np.arange(70) * .4 + np.random.randn(70)
data2 = np.arange(50) * (- .2) + np.random.randn(50) + 29.
data = pd.Series(np.r_[data1, data2], index=idx)
_d = np.asarray(data)
# seasonally varying measurement uncertainty
S = data.groupby(lambda x: x.month).std()
_S = np.asarray(S[[t.month for t in data.index]])
# find optimal parameters
res = minimize(F, (data.mean(), data.mean(),
data.mean(), data.index.size / 2.),
(_d, _S), method="L-BFGS-B",
bounds=((None, None), (None, None), (None, None),
(0., float(_d.size))))
y1, y2, y3, t2 = res.x
# plot results
data.plot(style="*")
tmin, tmax = data.index[0].ordinal, data.index[-1].ordinal
t2 = tmin + t2
ax = plt.gca()
ax.plot([data.index[0], t2], [y1, y2], 'r-', lw=2.)
ax.plot([t2, data.index[-1], ], [y2, y3], 'r-', lw=2.)
plt.show()
---8<-------
The only a-priori is the number of breakpoints, one. However, this has
the drawback that there is no estimate for the uncertainties of the fit
parameters. Of course, this could be done by bootstrapping ...
I found MARS, which might be worthwhile to look at.
Links:
- http://www.milbo.users.sonic.net/earth/
- http://dx.doi.org/10.1214/aos/1176347963
- http://en.wikipedia.org/wiki/Multivariate_adaptive_regression_splines
Actually, I just found this cython implementation of the MARS algorithm:
https://github.com/jcrudy/py-earth/
Do you have any other suggestions?
I'll play around a bit and report my experiences here, if there's interest.
Cheers, Andreas.

Robert McMurry
I'm new to this group, but I just wanted to say thanks this really helped me out with a very similar problem.
josef...@gmail.com
since I just saw a question about this again.
patsy has splines now
There is some related work that is not merged, but nothing for careful
selection of knot points in splines.
below is a reply that I never sent (written two years ago, so
outdated. And I don't know why I didn't hit send.)
--------------------------
From some messages on the scikit-learn mailing list it sounds like they
will get "earth" (since MARS is patented or protected as name)
There is some literature on estimating break points in econometrics, where
I never looked enough at the literature since mid 90's or so. Bai, Hansen
The standard test was a sup or mean lagrange multiplier or likelihood ratio
test to find or test for one break point. But it requires tables for the
distribution of the test statistic. (Andrews Ploberger)
For splines, I pretty much focused on penalized splines, which sound
nicer to me than spending a lot of time looking for the best location of a
few knots.
As far as I remember, in some cases we still get the same asymptotic
uncertainty estimates, standard deviation for the parameters, even if we
pretest or estimate the break points, (but that's vague memories of what
I might have read.)
If you know that you have exactly or at most one break point, then it's
just a simple trying out the break at each observation (excluding boundaries).
I'm not sure this is true for linear splines and not just structural breaks in
the regression.
------------------
Josef
>
> Cheers, Andreas.

Hao Liu
Thank you. Josef. Really a lot of help for me.

Lorenzo Bottaccioli
How did you find out the way to indentify the breakpoints with multiple knots? I need a solution I'm getting crazy to solve this!
josef...@gmail.com
Hi Josef,
How did you find out the way to indentify the breakpoints with multiple knots? I need a solution I'm getting crazy to solve this!