Duplicate plots from statsmodels.api.graphics
19 views
Skip to first unread message

Adam Davis
Aug 10, 2017, 7:41:25 AM8/10/17
to pystatsmodels
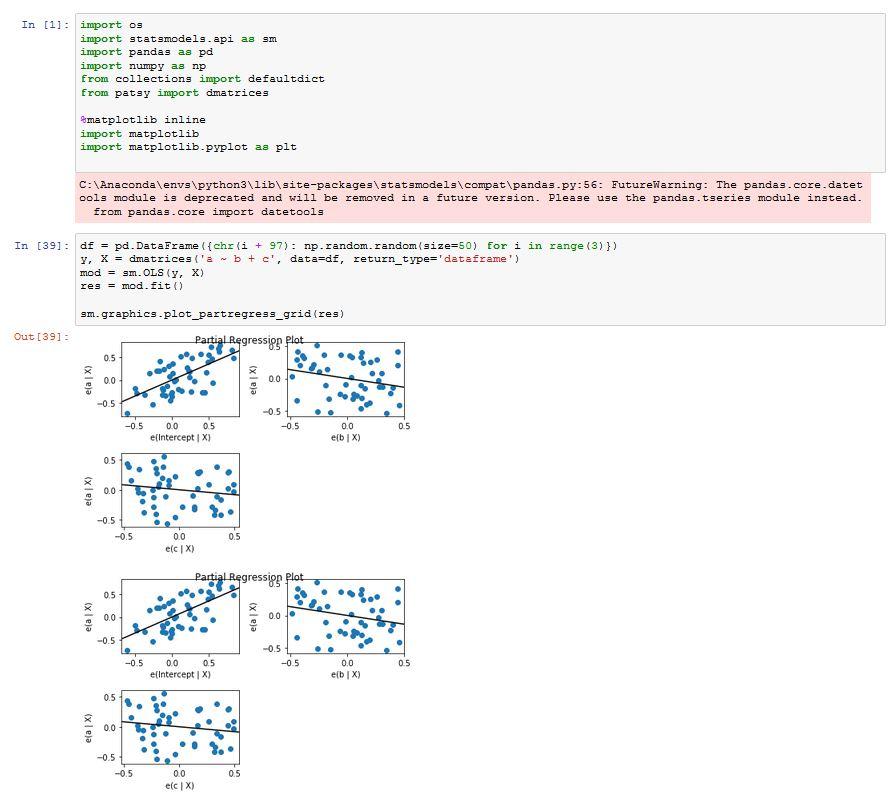
Using jupyter notebook, when I plot regresssions using statsmodels.api.graphics, the plots are always duplicated (see attached Capture1). When I plot a simple scatter plot using matplotlib from the same imports and data, it only plots once, as expected. Has anyone encountered this before? Can anyone suggest how to prevent the duplicates?
Please refer to code below.
Thanks,
Adam
import os
import statsmodels.api as sm
import pandas as pd
import numpy as np
from collections import defaultdict
from patsy import dmatrices
%matplotlib inline
import matplotlib
import matplotlib.pyplot as plt
df = pd.DataFrame({chr(i + 97): np.random.random(size=50) for i in range(3)})
y, X = dmatrices('a ~ b + c', data=df, return_type='dataframe')
mod = sm.OLS(y, X)
res = mod.fit()
sm.graphics.plot_partregress_grid(res) # duplicate plots
plt.scatter(df.a, df.b) #single scatter plot, as expected

josef...@gmail.com
Aug 10, 2017, 7:45:27 AM8/10/17
to pystatsmodels
That's the behavior of the notebook and nothing we can/will do about it.
You can assign the returned figure to something or `_`
Josef
Adam Davis
Aug 10, 2017, 8:38:14 AM8/10/17
to pystatsmodels
Josef,
Assigning the return value is an acceptable workaround for me. Many thanks for pointing me at the relevant github issue for context.
Regards,
Adam
Assigning the return value is an acceptable workaround for me. Many thanks for pointing me at the relevant github issue for context.
Regards,
Adam
Reply all
Reply to author
Forward
0 new messages