Plotting wind barbs
69 views
Skip to first unread message

Wilfred Janssen
Apr 5, 2017, 8:20:47 AM4/5/17
to pyqtgraph
Hello everybody,
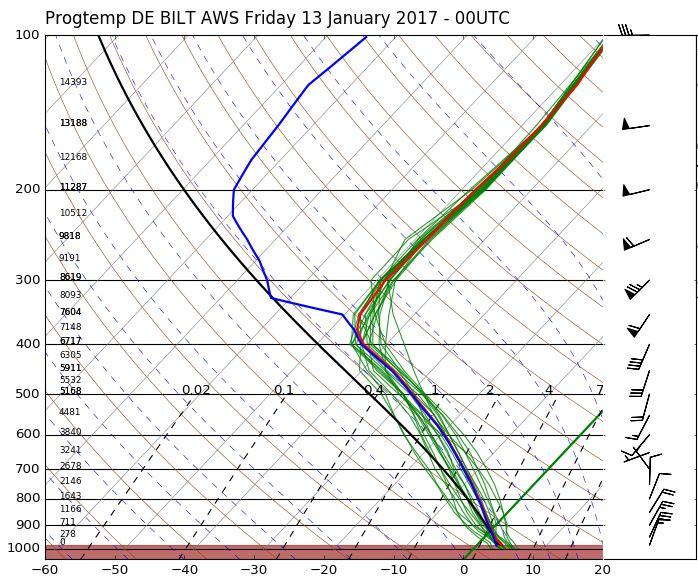
I'm currently working on a Skew-T/log(P) diagram. This diagram is used for the presentation of weather balloon data. Before I started to use PyQtGraph, I worked with matplotlib. However, matploblib is horribly slow when it comes to interactive plotting. The plotting of the main diagram with temperature data went pretty smooth, now I'm stuck with plotting the wind barbs. For information: the barbs has to be plotted in a secondary widget with linked y-axis.
I tried to plot the wind barbs in a regular coordinate system where I plot all the individual lines to create one or multiple wind barbs. But when it comes to logarithmic y-axis and interactive zooming/panning, the barbs are completely out of the normal aspect ratio and become completely unuseful. Is there any way where the plotted wind barbs maintain their aspect ratio while panning/zooming around in the plot?
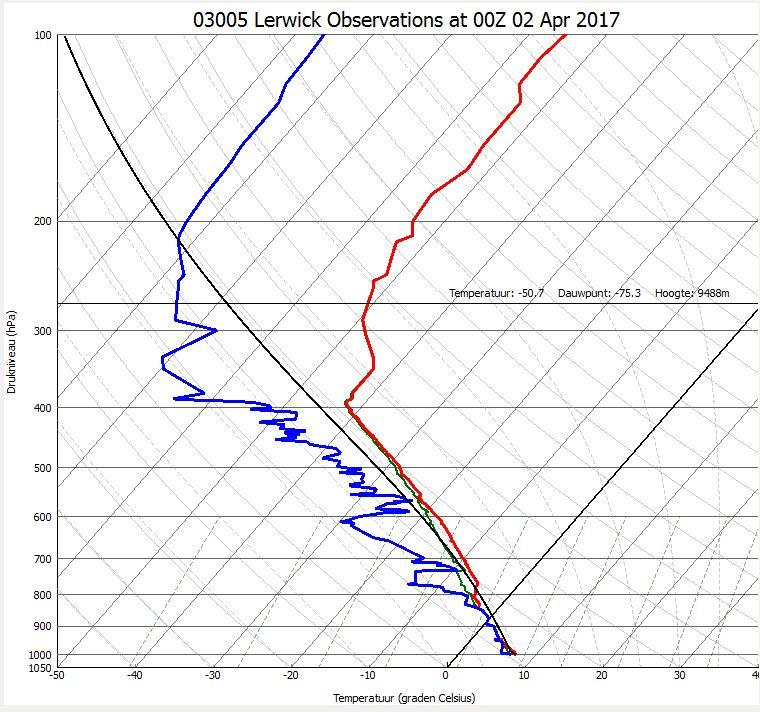
I attached two examples: one from matplotlib with the wind barbs included and one made with PyQtGraph without the barbs, so you have any idea about the final result. I hope somebody can help with this. Without wind barbs, the vertical profiles are very, very incomplete!
Wilfred Janssen

Alex Schueth
Apr 5, 2017, 1:47:04 PM4/5/17
to pyqtgraph
Hi Wilfred,
A bit off topic but scientifically, SHARPpy (https://github.com/sharppy/SHARPpy) has become somewhat of a standard of plotting skewT diagrams here in the states. The GUI is interactive and can load in different datasets (as long as they are in the right format). However, this can be customized with their backend as well. I would recommend using this for future skewT plotting needs. However, if you still want to use pyqtgraph, looking at the source code of SHARPpy or MetPy (https://github.com/Unidata/MetPy) should help with the plotting of vertical wind barbs.
Alex Schueth
Reply all
Reply to author
Forward
0 new messages