plot customization problem
22 views
Skip to first unread message

richard wan
Jul 11, 2016, 10:42:28 PM7/11/16
to pyqtgraph
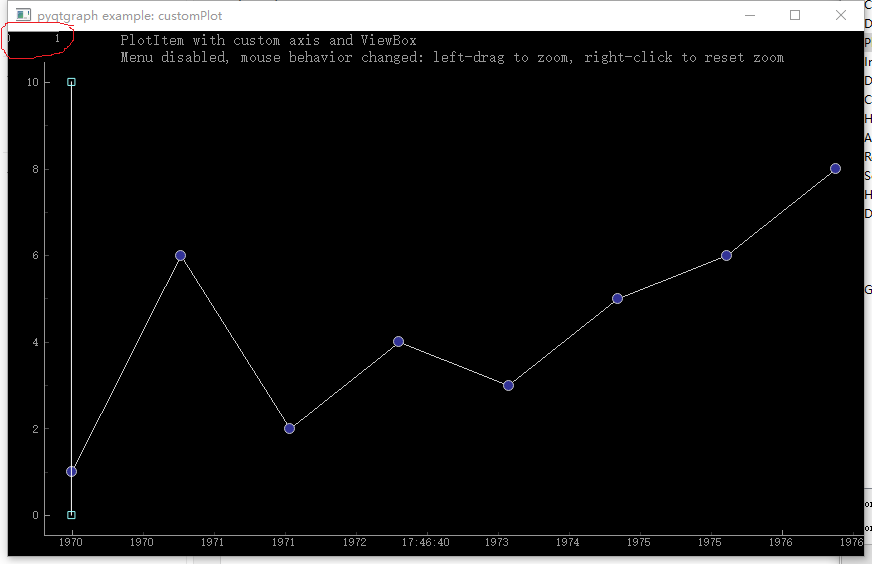
See the following screen-shot. I am confused that what is that in the red circle, is that a map scale or something like that? how can I hide that? why there is no that thing when i do not customize
the bottom axis?
Thanks a lot?

Vincent Le Saux
Jul 20, 2016, 8:38:32 AM7/20/16
to pyqtgraph
Hi,
Vincent
Reply all
Reply to author
Forward
0 new messages